Blurred dark background with gradient shades of green and blue.
Simplified navy blue DNA double helix icon on white background.
Conviction

From Clinical Evidence to Investment Conviction

Healthcare investing moves quickly. Trial readouts, regulatory decisions, label updates, competitor launches, pricing changes, payer signals, and management commentary can change an asset thesis in hours.

Yet traditional forecasting workflows often lag the market. Analysts still spend too much time gathering evidence, wiring patient-flow models, updating assumptions, and manually rebuilding scenarios before they can understand what changed and why it matters.

PharmaCast-AI helps close that gap by turning evidence into structured assumptions, patient-based revenue forecasts, scenario comparisons, and sensitivity views that analysts can review, adjust, and export into their existing valuation workflows.

From evidence to investment decisions

PharmaCast-AI transforms data and assumptions into defensible forecasts that power confident investment theses.

1

Evidence

Icon of a document with lines and a magnifying glass over the bottom right corner.

Aggregate and organize the clinical, commercial, and competitive evidence.

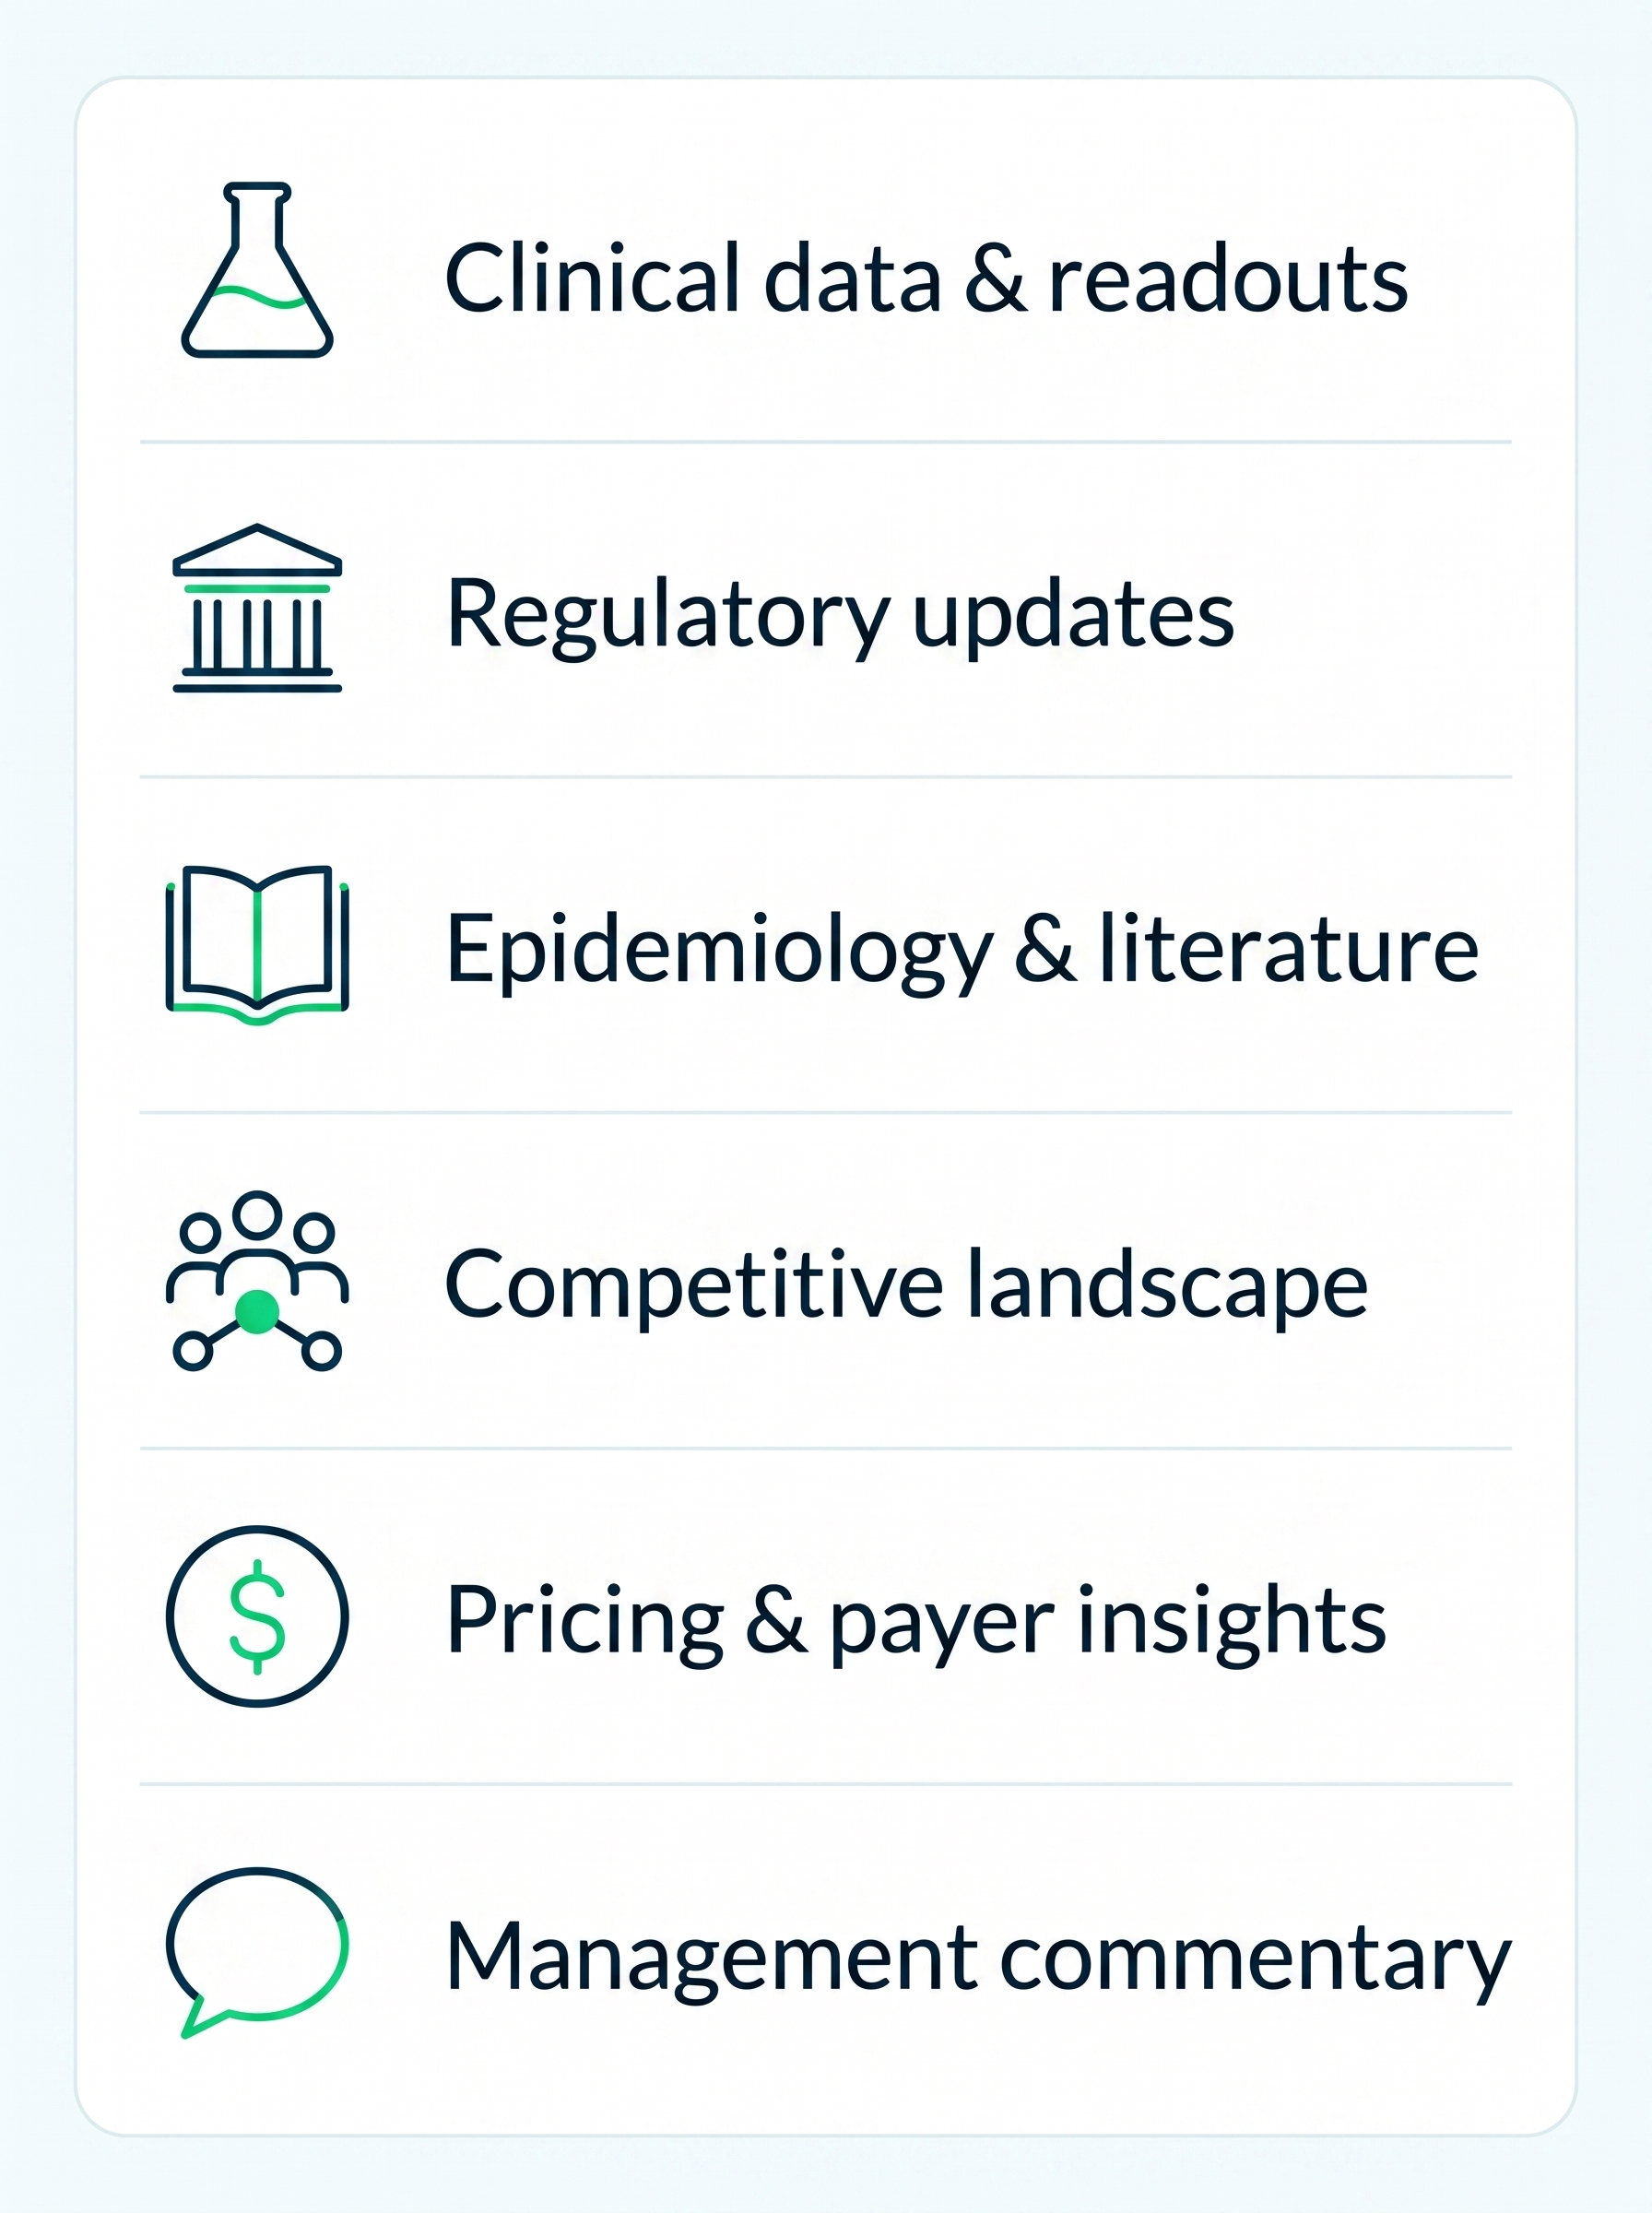
List with icons: Clinical data, Regulatory updates, Epidemiology, Competitive landscape, Pricing, Management commentary.

2

Assumptions

Clipboard icon with two green check marks and two lines each representing completed tasks.

AI-assisted assumption development with source context and rationale.

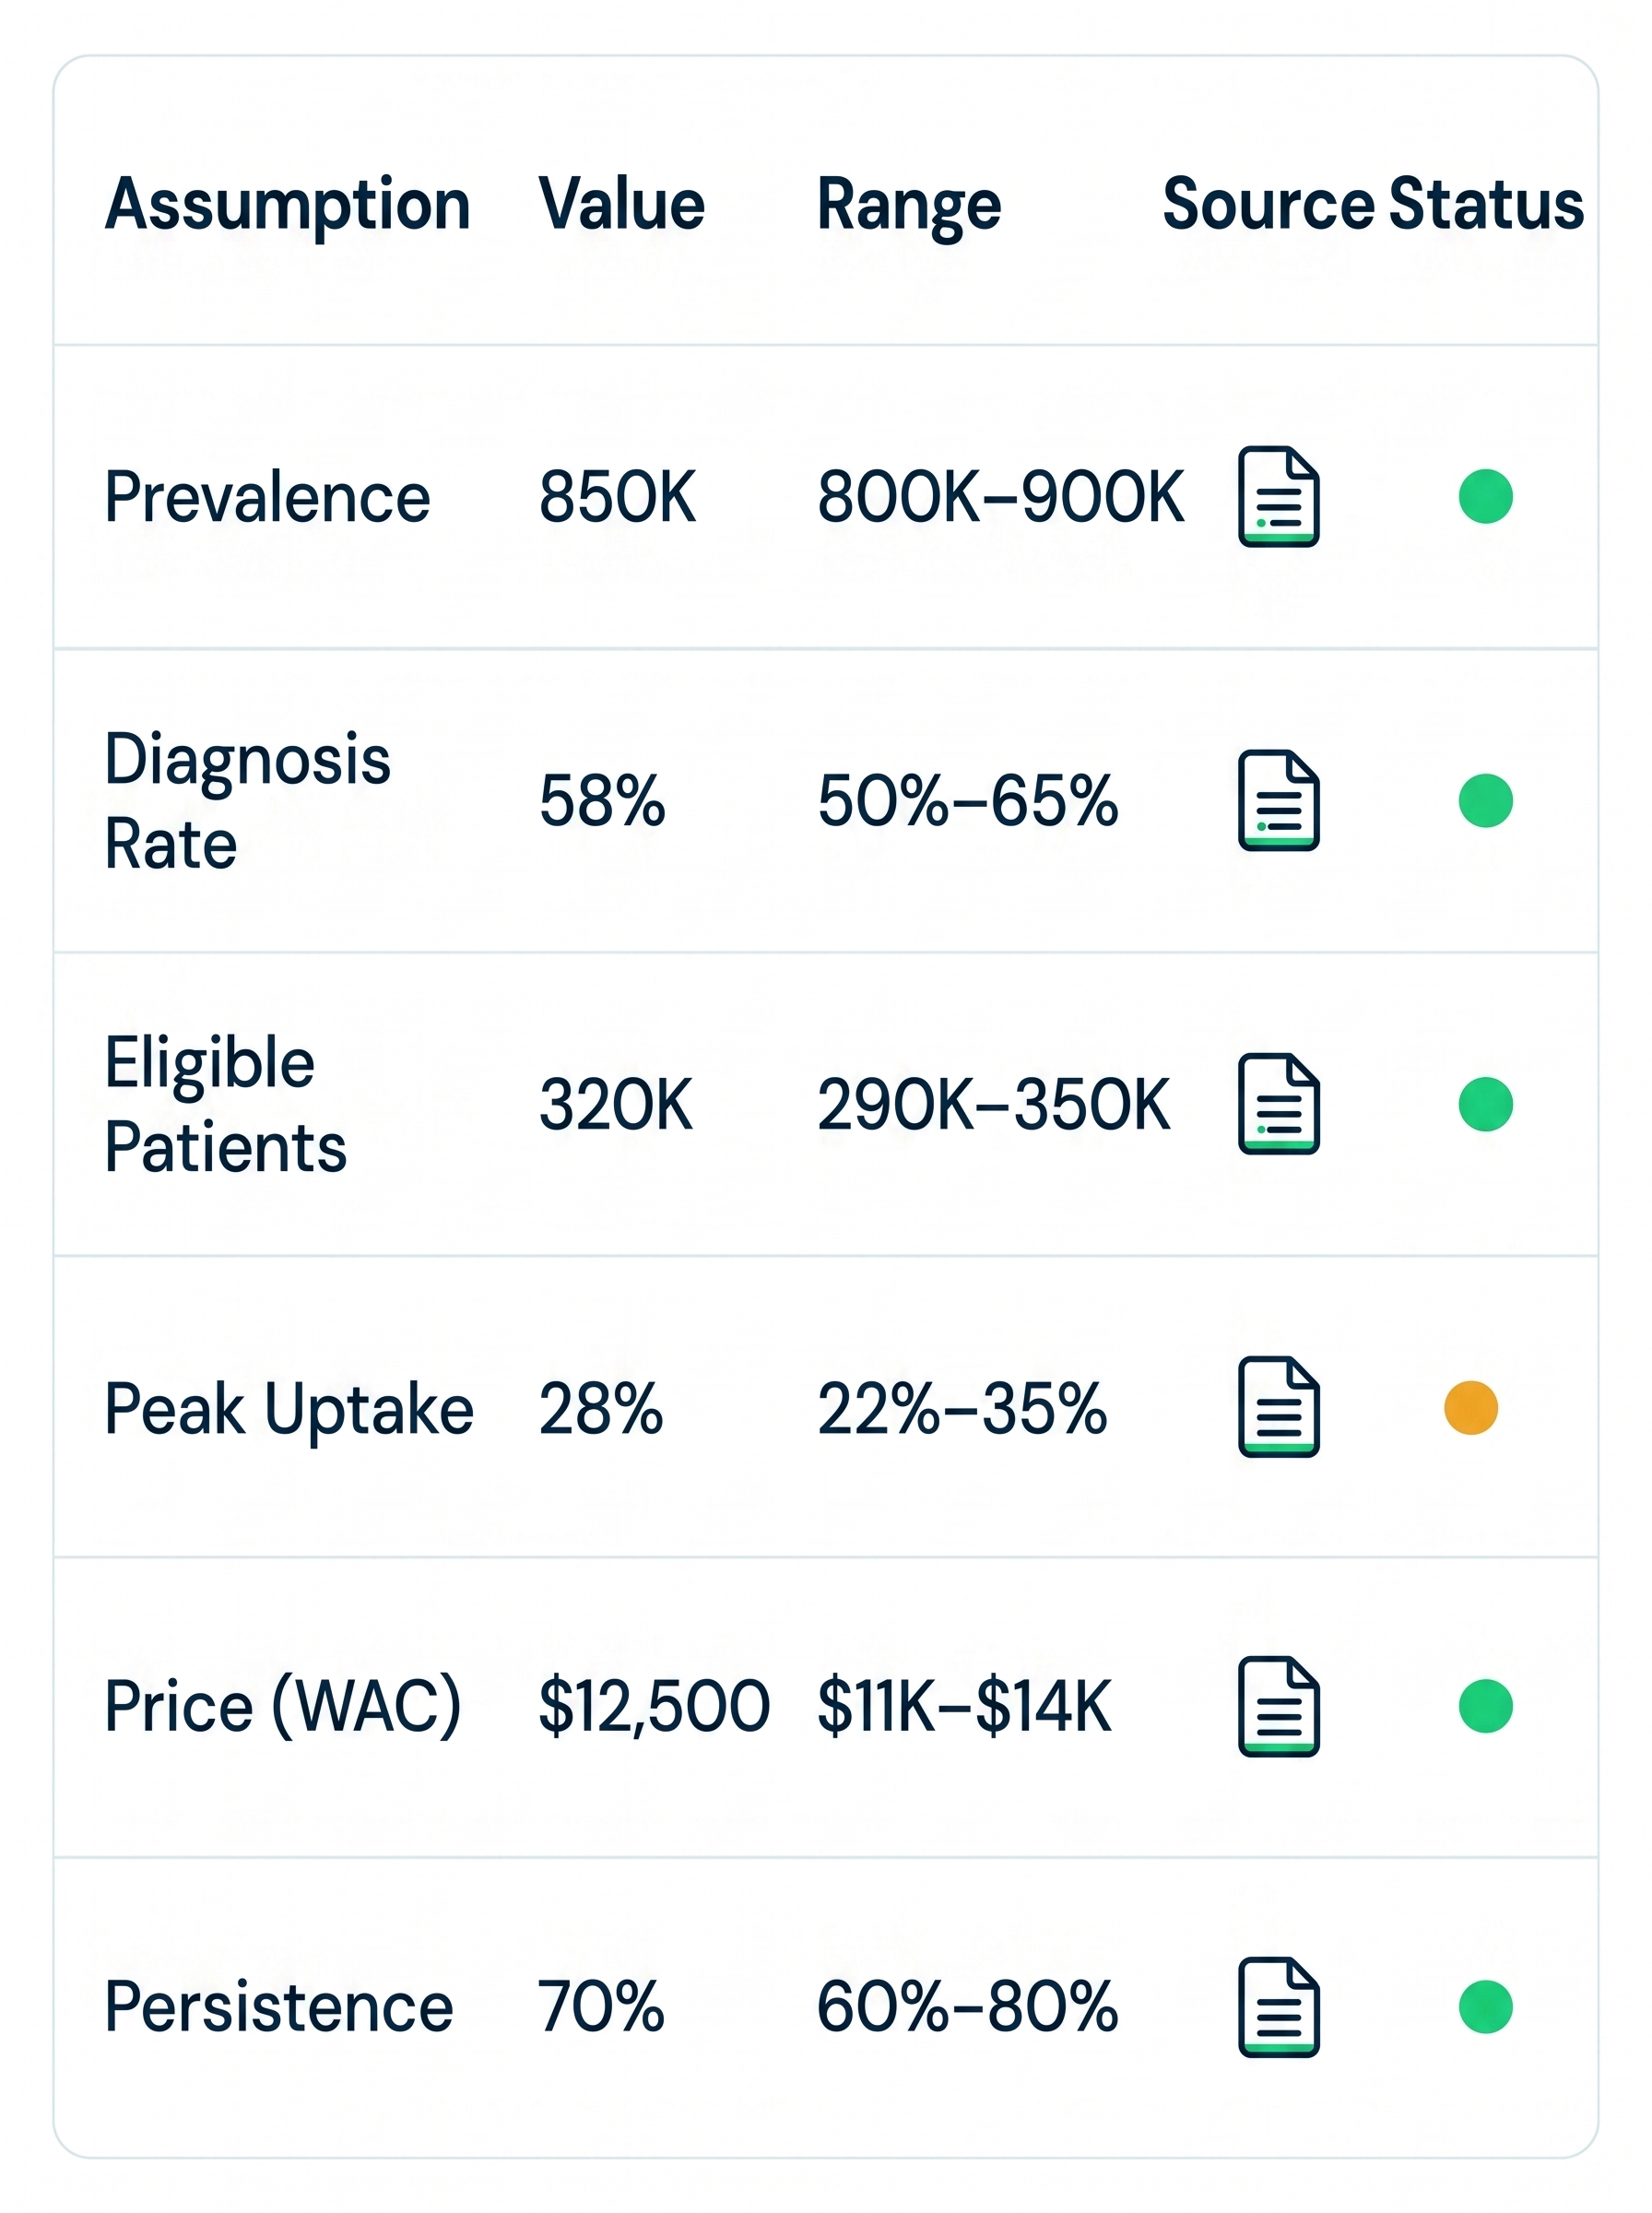
Table listing assumptions with values, ranges, and status indicators; most are green except peak uptake which is yellow.

3

Patient-flow forecast

Icon of three people with two green arrows pointing down to the first and second person.

Teams retain full control over the critical inputs that drive valuation and return.

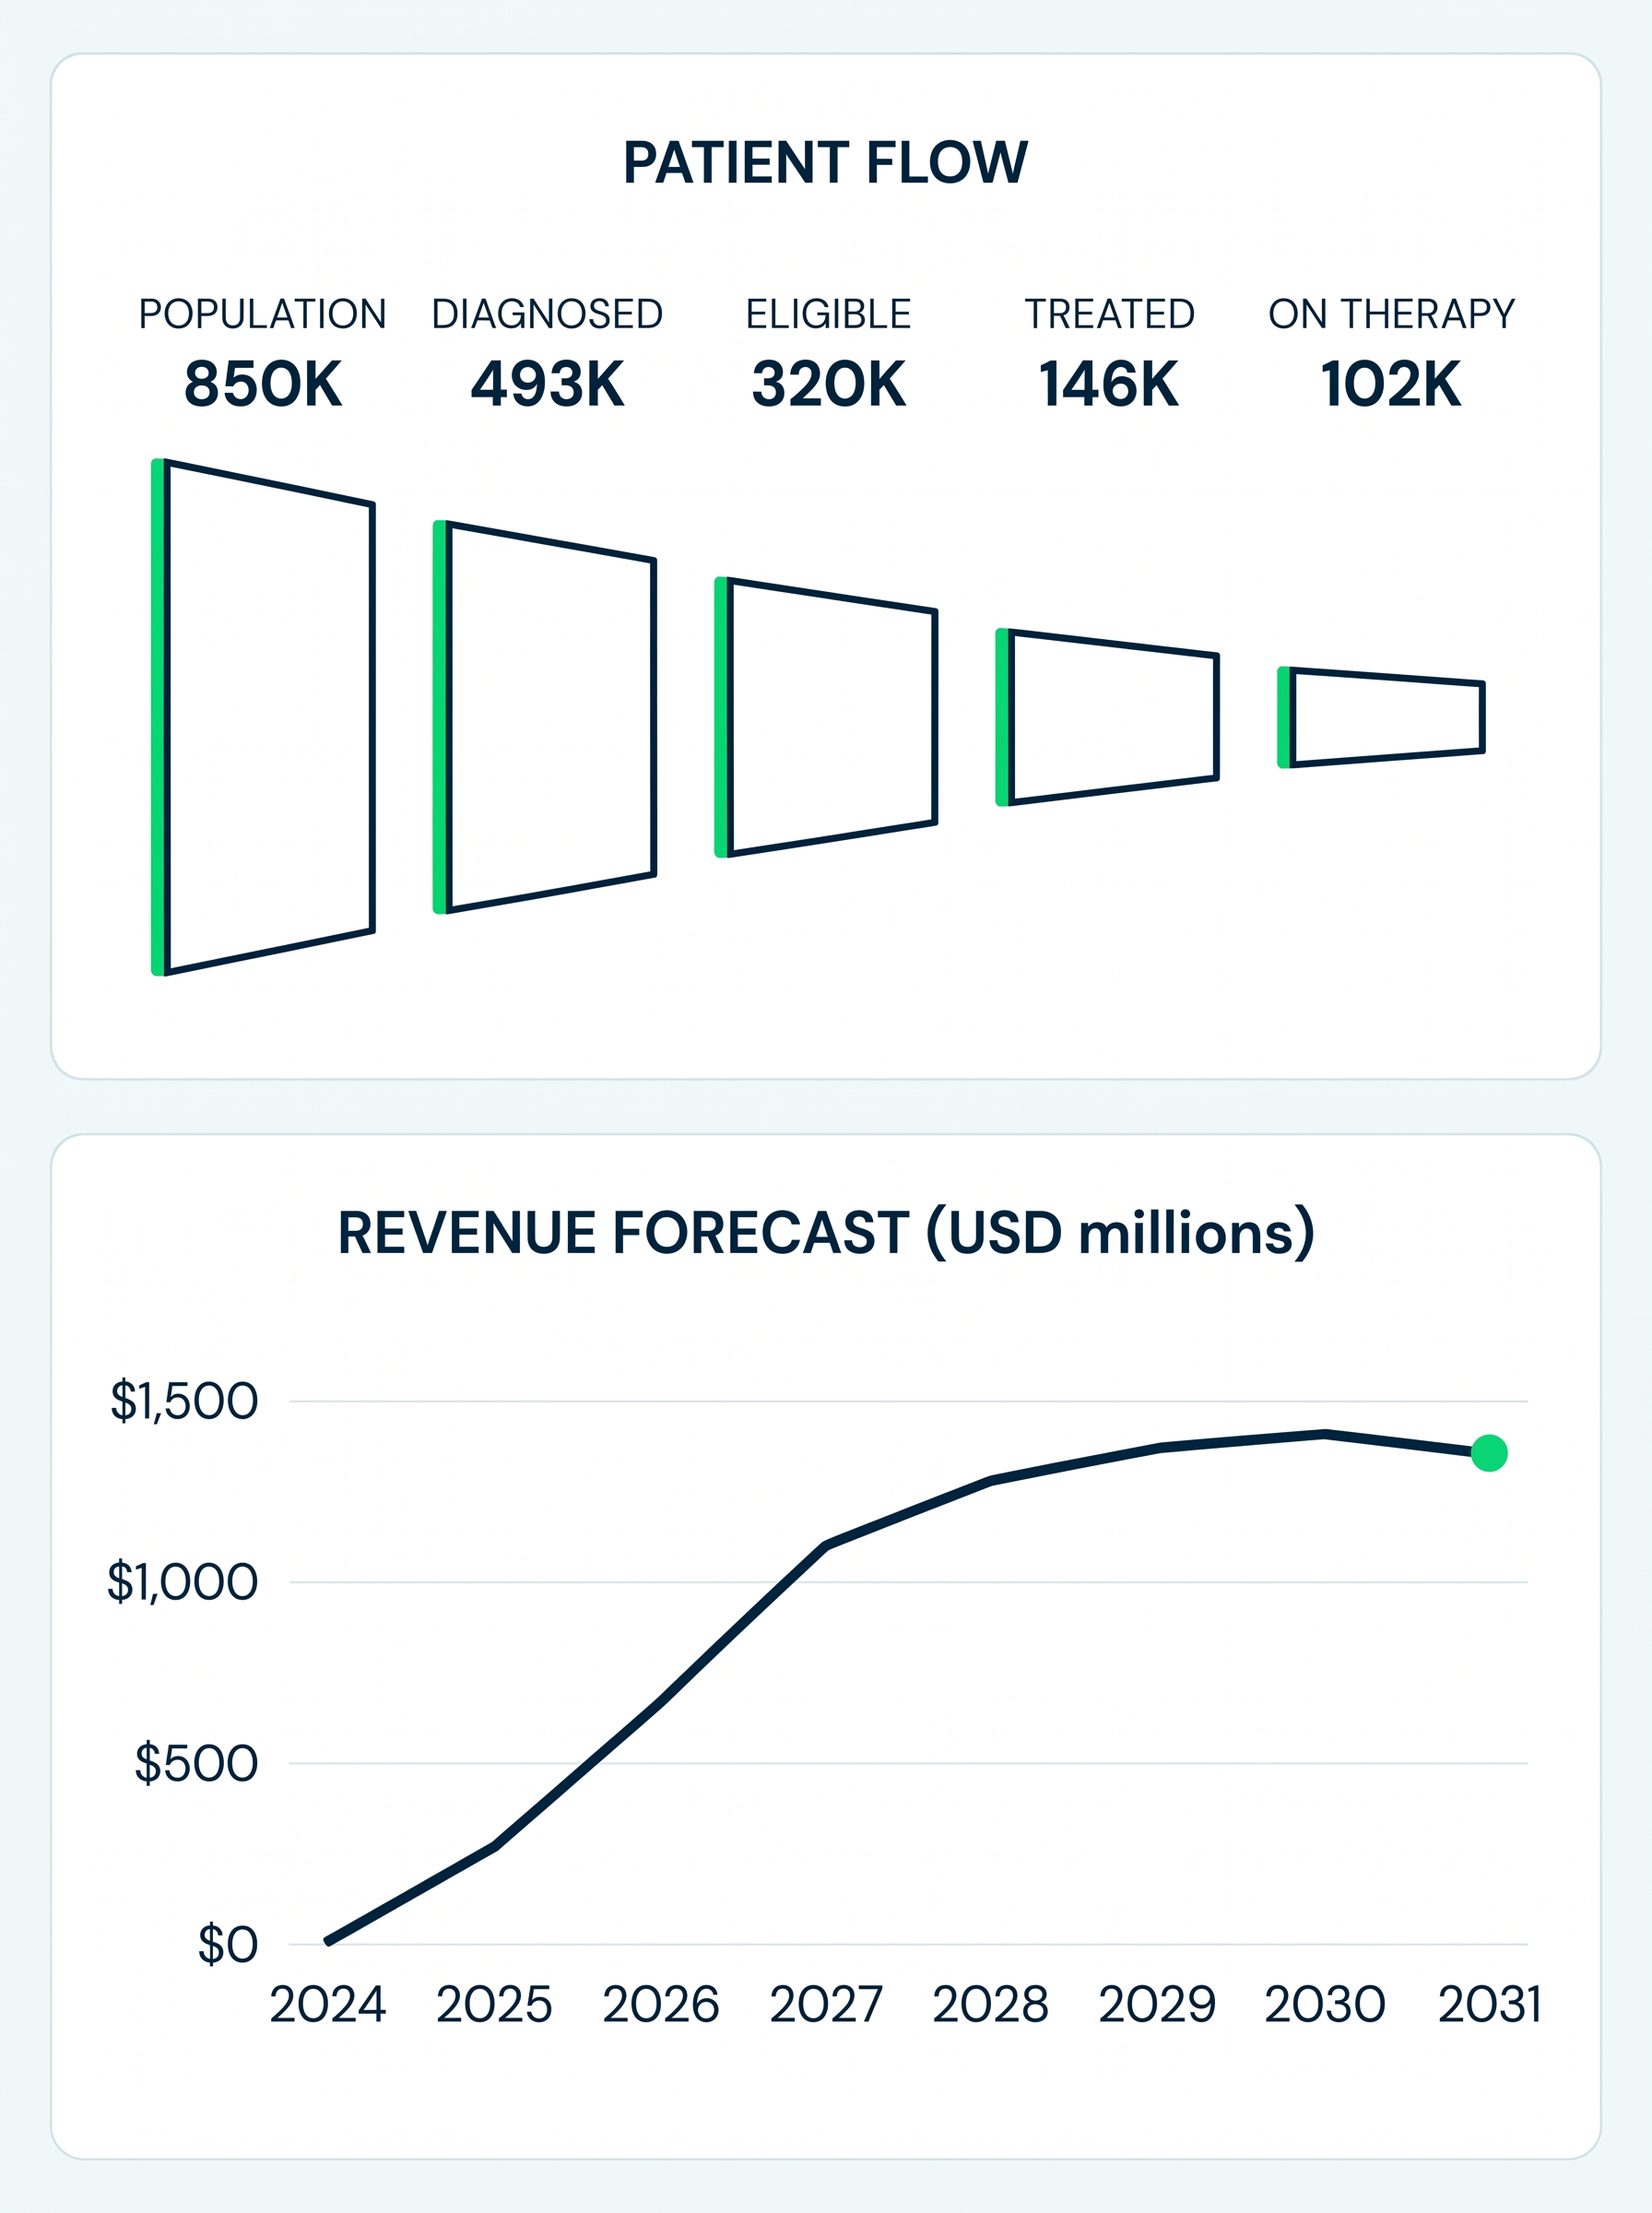
Patient flow funnel shows population 850K to 102K on therapy; revenue forecast rises to $1.5B by 2030 then dips.

4

Scenarios & sensitivity

Four black arrows pointing up, down, left, and right from a green dot center in a light blue circle.

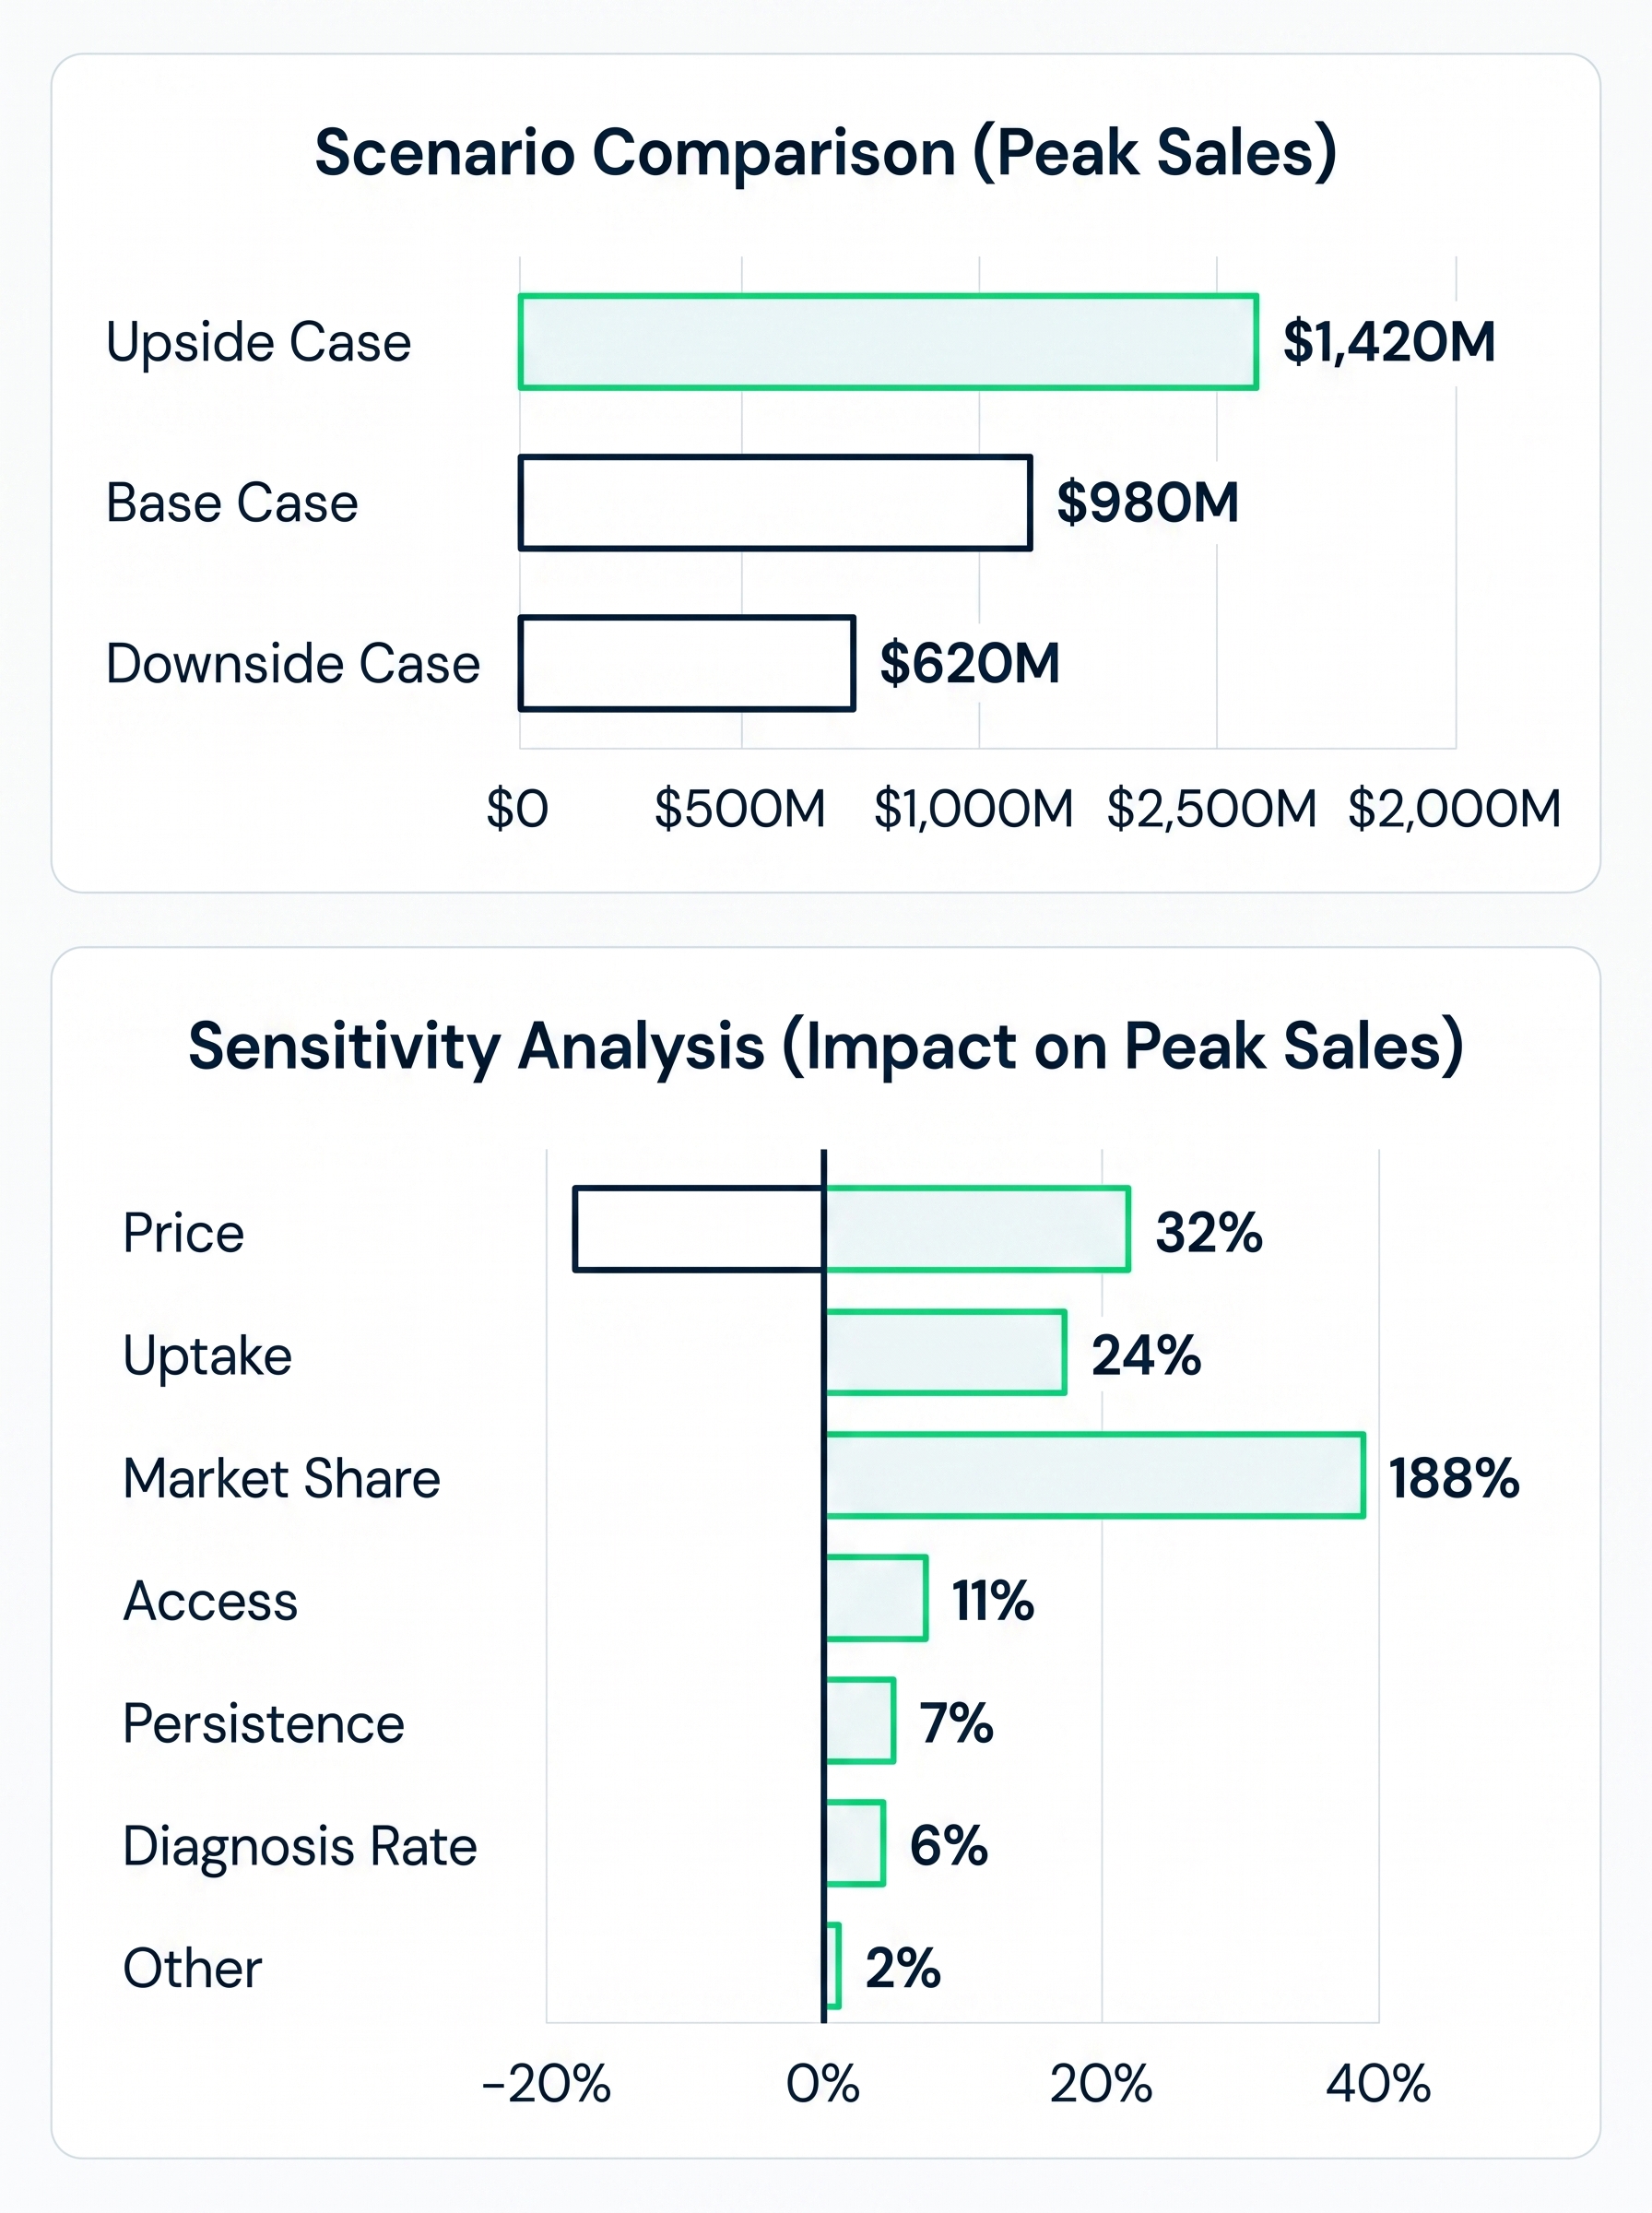
Test key drivers and events to understand the range of outcomes and value drivers.

Bar charts comparing peak sales scenarios and sensitivity analysis impact on peak sales percentages.

5

Valuation-ready outputs

Document icon with ascending bar chart showing increasing values, last bar highlighted in green.

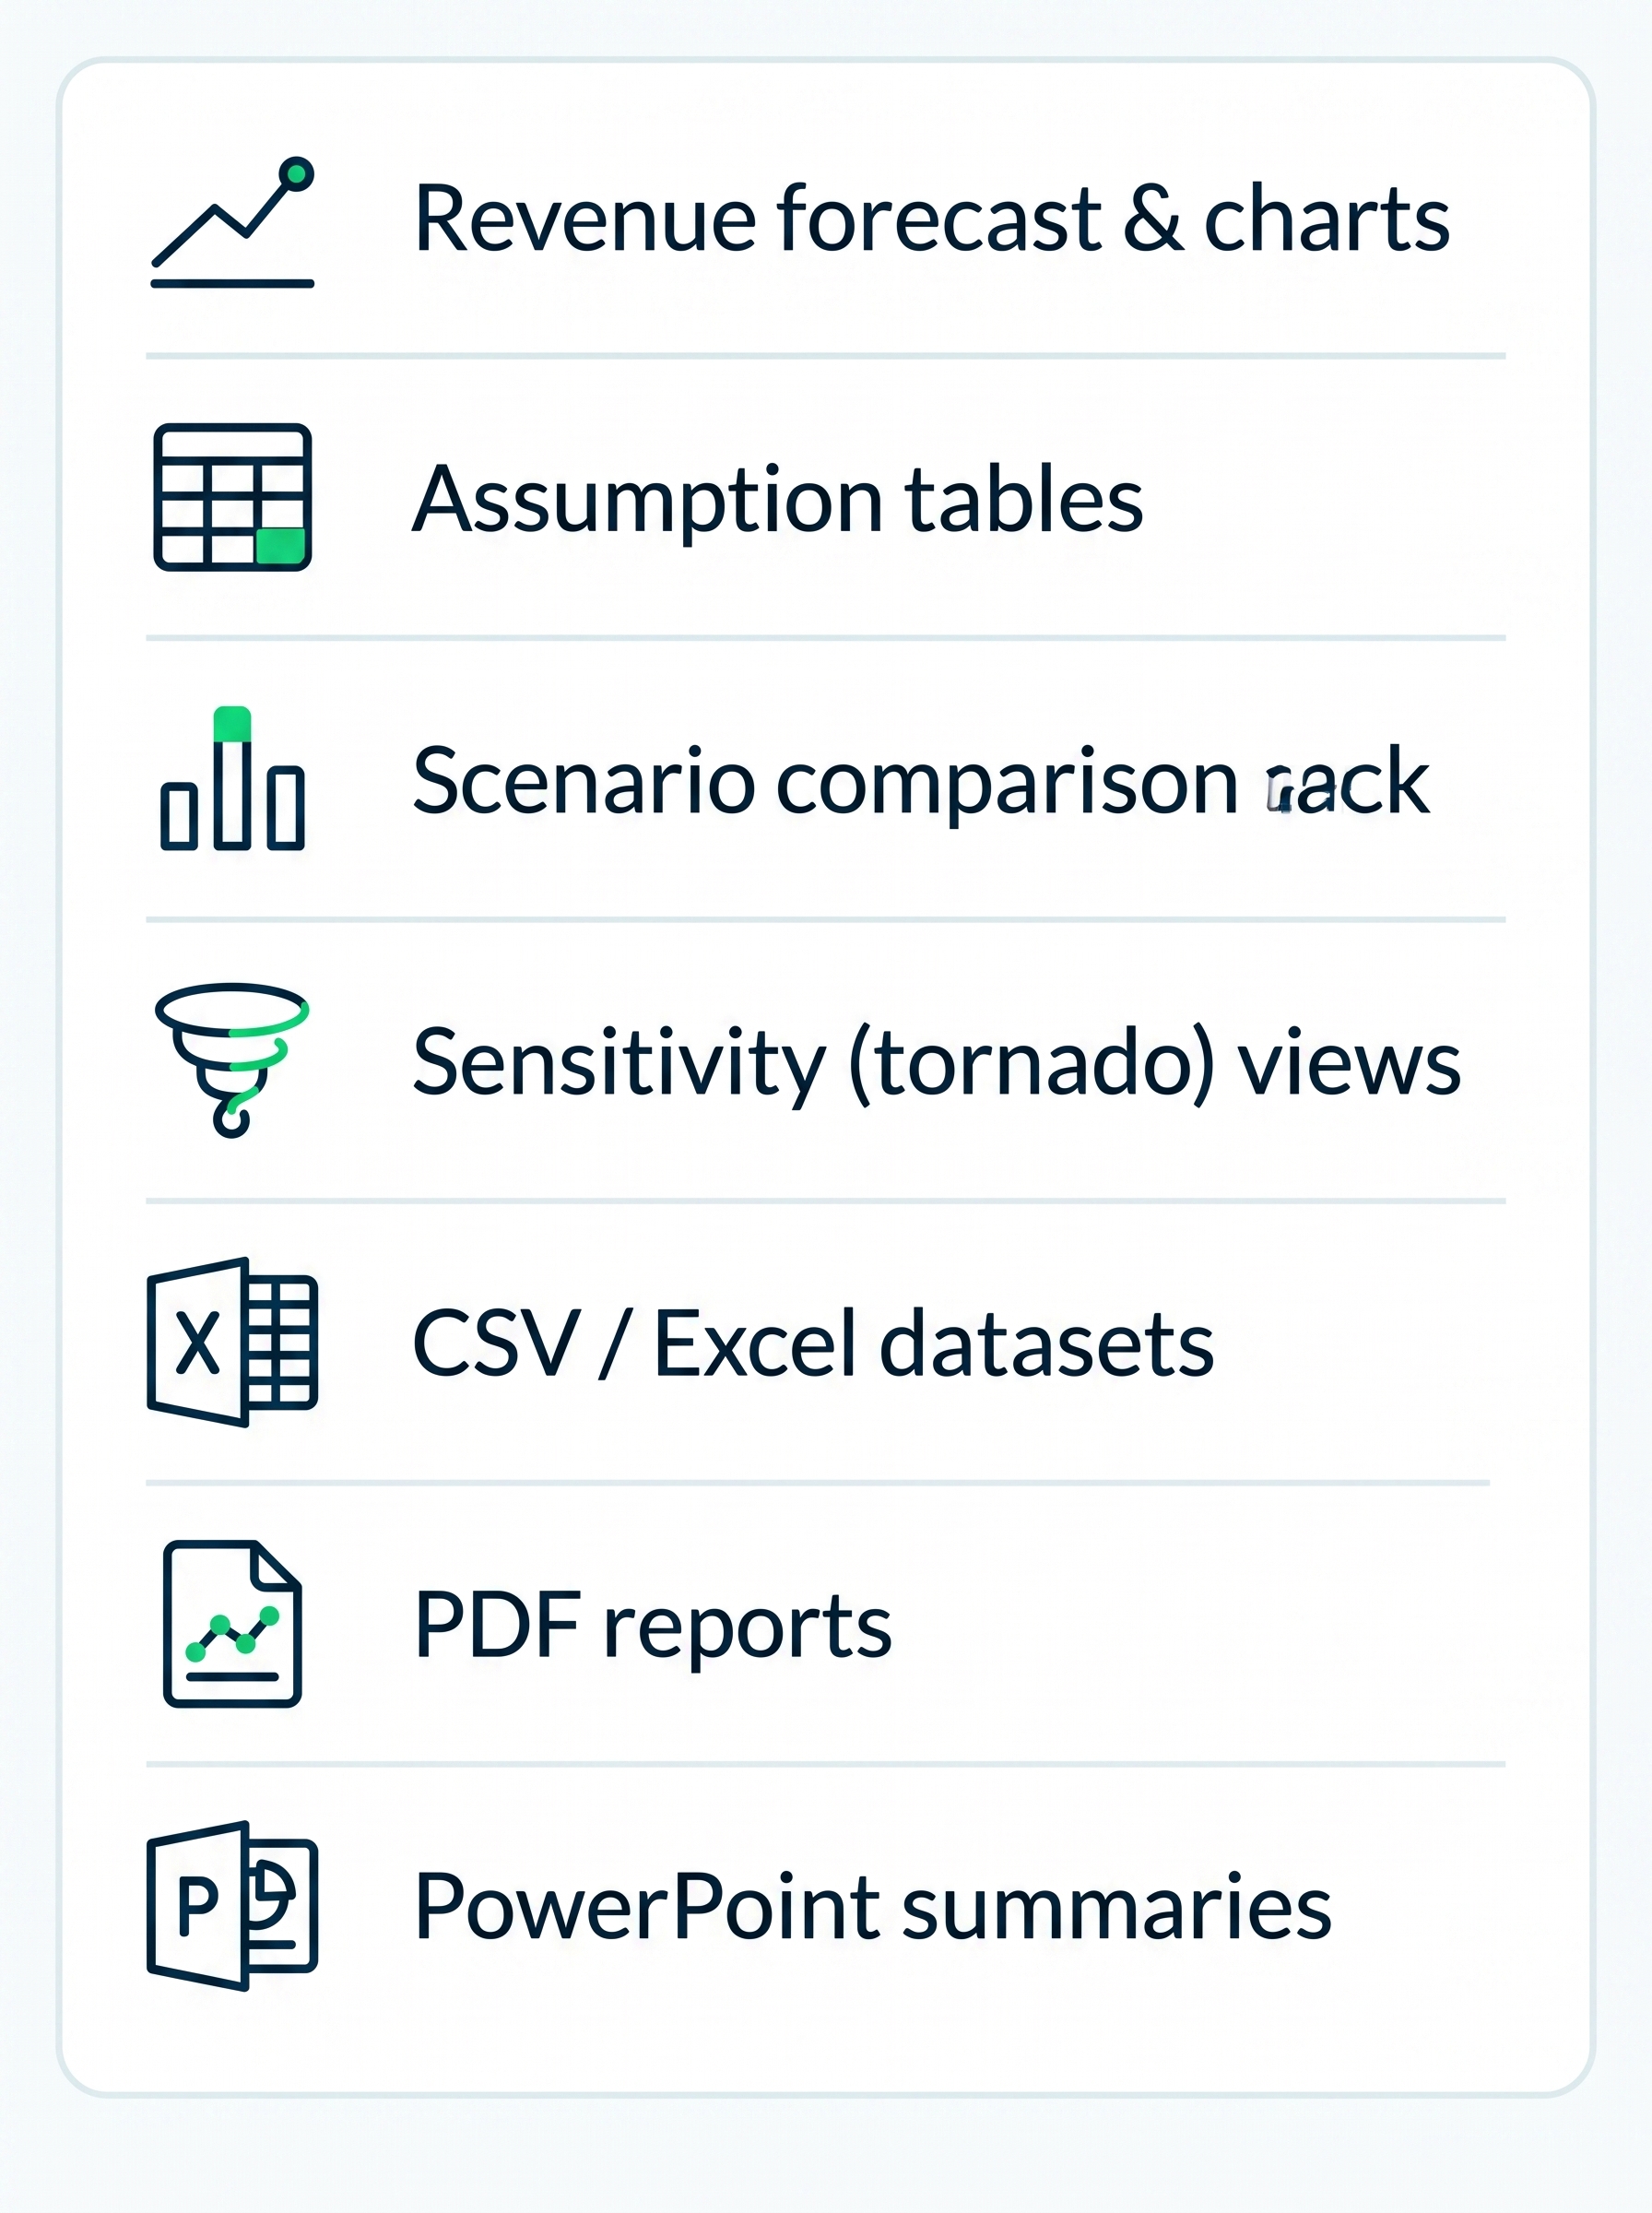
Export clean, decision-ready materials for valuation models, and committees.

Icons and text listing revenue forecast, assumption tables, scenario comparison, sensitivity views, CSV, PDF, and PowerPoint.
Analyst control

Review, edit, approve, and document assumptions and forecasts.

Source-traceable

Every assumption is linked to source, rationale, and review status.

Governed & auditable

Full history, version control, and access controls for completeness.

Built for investors

Designed for healthcare investors who demand speed and rigor.

Workflows

Built for the Way Healthcare Investors Work

PharmaCast-AI is designed for the recurring questions that finance and investment teams face when evaluating pharma and biotech opportunities

Icon

Public equity coverage and event reaction

Green lightning bolt icon symbolizing energy or power.

What Teams Need: Update asset forecasts quickly after clinical, regulatory, commercial, or competitive events

  • How PharmaCast-AI helps: Refresh assumptions, compare scenarios, and generate source-supported forecast outputs without rebuilding the model from scratch.
Icon

Deep-dive diligence and thesis development

Green lightning bolt icon with sharp angles on a white background.

What Teams Need: Understand market size, eligible patients, treatment flow, pricing, uptake, persistence, and peak revenue potential.

  • How PharmaCast-AI helps: Build structured patient-flow revenue forecasts with transparent assumptions that analysts can review and adjust.
Icon

Private-market and transaction diligence

What Teams Need: Evaluate assets, companies, royalty streams, or financing opportunities under compressed timelines.

  • How PharmaCast-AI helps: Create a defensible baseline forecast, then stress-test launch timing, market share, pricing, and competitive dynamics.
Icon

Portfolio monitoring and coverage consistency

What Teams Need: Maintain a consistent view across assets, companies, indications, and analysts.

  • How PharmaCast-AI helps: Use a repeatable methodology and centralized assumption structure while preserving flexibility by disease area and asset stage.
Icon

Investment committee and client communication

What Teams Need: Explain not just the forecast, but the evidence and assumptions behind it.

  • How PharmaCast-AI helps: Produce outputs that make key assumptions, sources, scenarios, and value drivers easier to communicate and defend.
Workflows

Built for the way healthcare investment teams work

Different investment teams ask different questions, but they all need credible assumptions, transparent patient-flow logic, fast scenario testing, and outputs that support investment judgment.

Rocket launching upward alongside rising bar chart and an upward trending arrow.

1

Public equity coverage & catalyst reaction

Key question

What changed in the thesis?

Primary users

Buy-side analysts, portfolio managers, sell-side analysts

How PharmaCast-AI helps

Refresh assumptions after clinical, regulatory, commercial, or competitive events and compare the impact across base, upside, and downside cases.

Outputs

Updated revenue forecast

Scenario comparison

Assumption changes

Outline of microscope examining data bars on a computer screen inside a light blue circle.

2

Deep-dive diligence & thesis development

Key question

How large is the opportunity?

Primary users

Healthcare analysts, sector specialists, research teams

How PharmaCast-AI helps

Structure epidemiology, treatment flows, pricing, access, uptake, persistence, and competition into a patient-based forecast.

Outputs

Patient-flow forecast

Peak sales estimate

Assumption summary

File folder with handshake icon and green check mark inside a circle on light blue background.

3

Private-market & transaction diligence

Key question

Is this asset, royalty stream, or financing opportunity attractive?

Primary users

VC, PE, royalty investors, bankers, strategic finance teams

How PharmaCast-AI helps

Build a defensible baseline forecast and pressure-test launch timing, market share, pricing, access, and competition under compressed timelines.

Outputs

Baseline forecast

Diligence pack

Scenario range

Line art of a capsule pill, connected molecular nodes, and a flask representing pharmaceutical research.

4

Portfolio monitoring & coverage consistency

Key question

Are we applying a consistent view across names and assets?

Primary users

Portfolio managers, investment teams, research directors

How PharmaCast-AI helps

Maintain consistent patient-flow methodology and centralized assumptions across companies, indications, and analysts while preserving flexibility by asset.

Outputs

Coverage comparison

Standardized views

Assumption history

Icon of three outlined people standing side by side, center person has a green head outline.

5

Investment committee & client communication

Key question

Can we explain and defend the forecast?

Primary users

Investment committees, client teams, LP reporting, portfolio managers

How PharmaCast-AI helps

Produce outputs that show the evidence, assumptions, value drivers, and scenarios behind the forecast.

Outputs

Forecast summary

Assumption table

Committee materials

Teams

Key Capabilities for Finance and Investment Teams

Pharma-specific patient-flow modeling

Model the commercial dynamics that matter in life sciences, including epidemiology, diagnosis and treatment flow, line-of-therapy dynamics, launch curves, pricing, uptake, and persistence.

AI-assisted assumption development

Move beyond the blank page with structured starting assumptions, ranges, and source context for analyst review.

Human-in-the-loop control

AI helps gather and organize the evidence, but your team decides which assumptions to use and how to interpret them.

Scenario and sensitivity analysis

Compare base, upside, and downside cases and identify which assumptions matter most to the asset forecast.

Excel-compatible outputs

Export revenue forecasts, patient-flow constructs, assumption tables, and summary materials into downstream Excel, BI, and presentation workflows.

Governance and auditability

Maintain clearer model histories, assumption rationale, access controls, and review trails for diligence and committee processes.

Key capabilities for finance and investment teams

Icon of three people: a large figure with a green halo and two smaller figures on each side.

1

Patient-based revenue forecasting

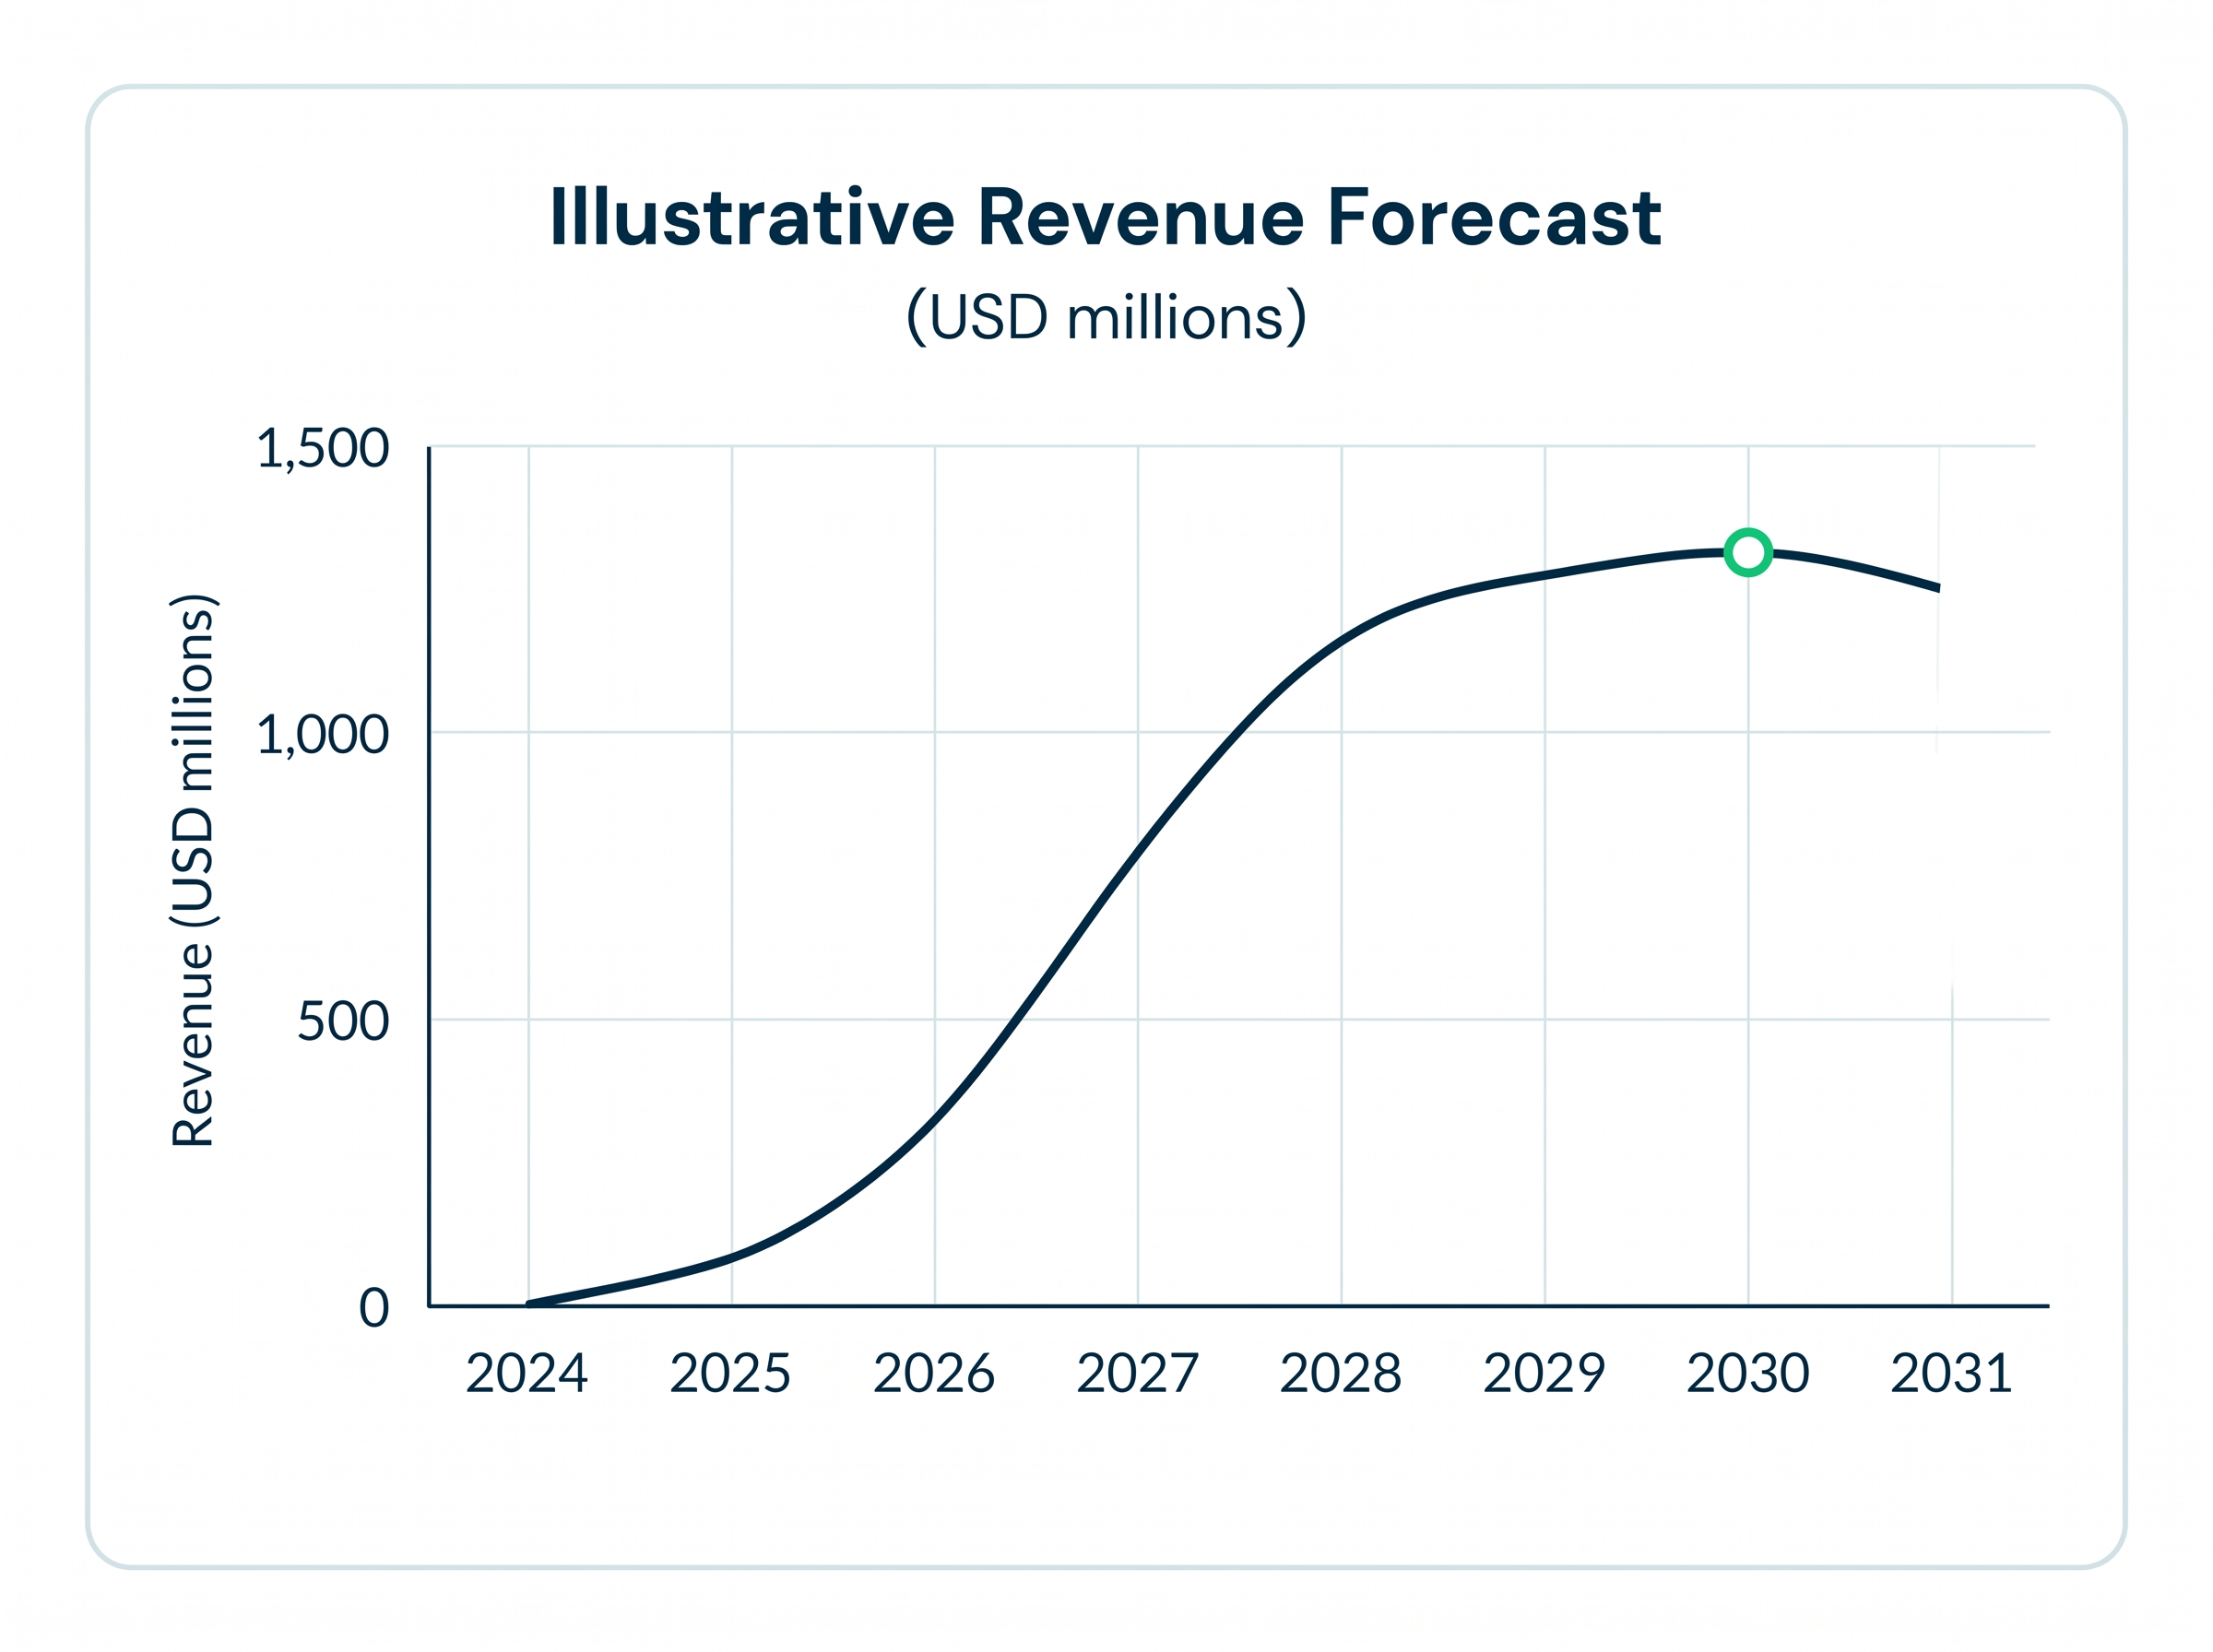
Model epidemiology, diagnosis, treatment flow, eligible patients, uptake, persistence, pricing, access, market share, and competition.

Line graph showing illustrative revenue forecast in USD millions from 2024 to 2031 with a peak near 2030.

Patient flow by line of therapy

Competition & market dynamics

Pricing & Access assumptions

Icon of a document with lines and a magnifying glass over the bottom right corner.

2

Source-traceable assumptions

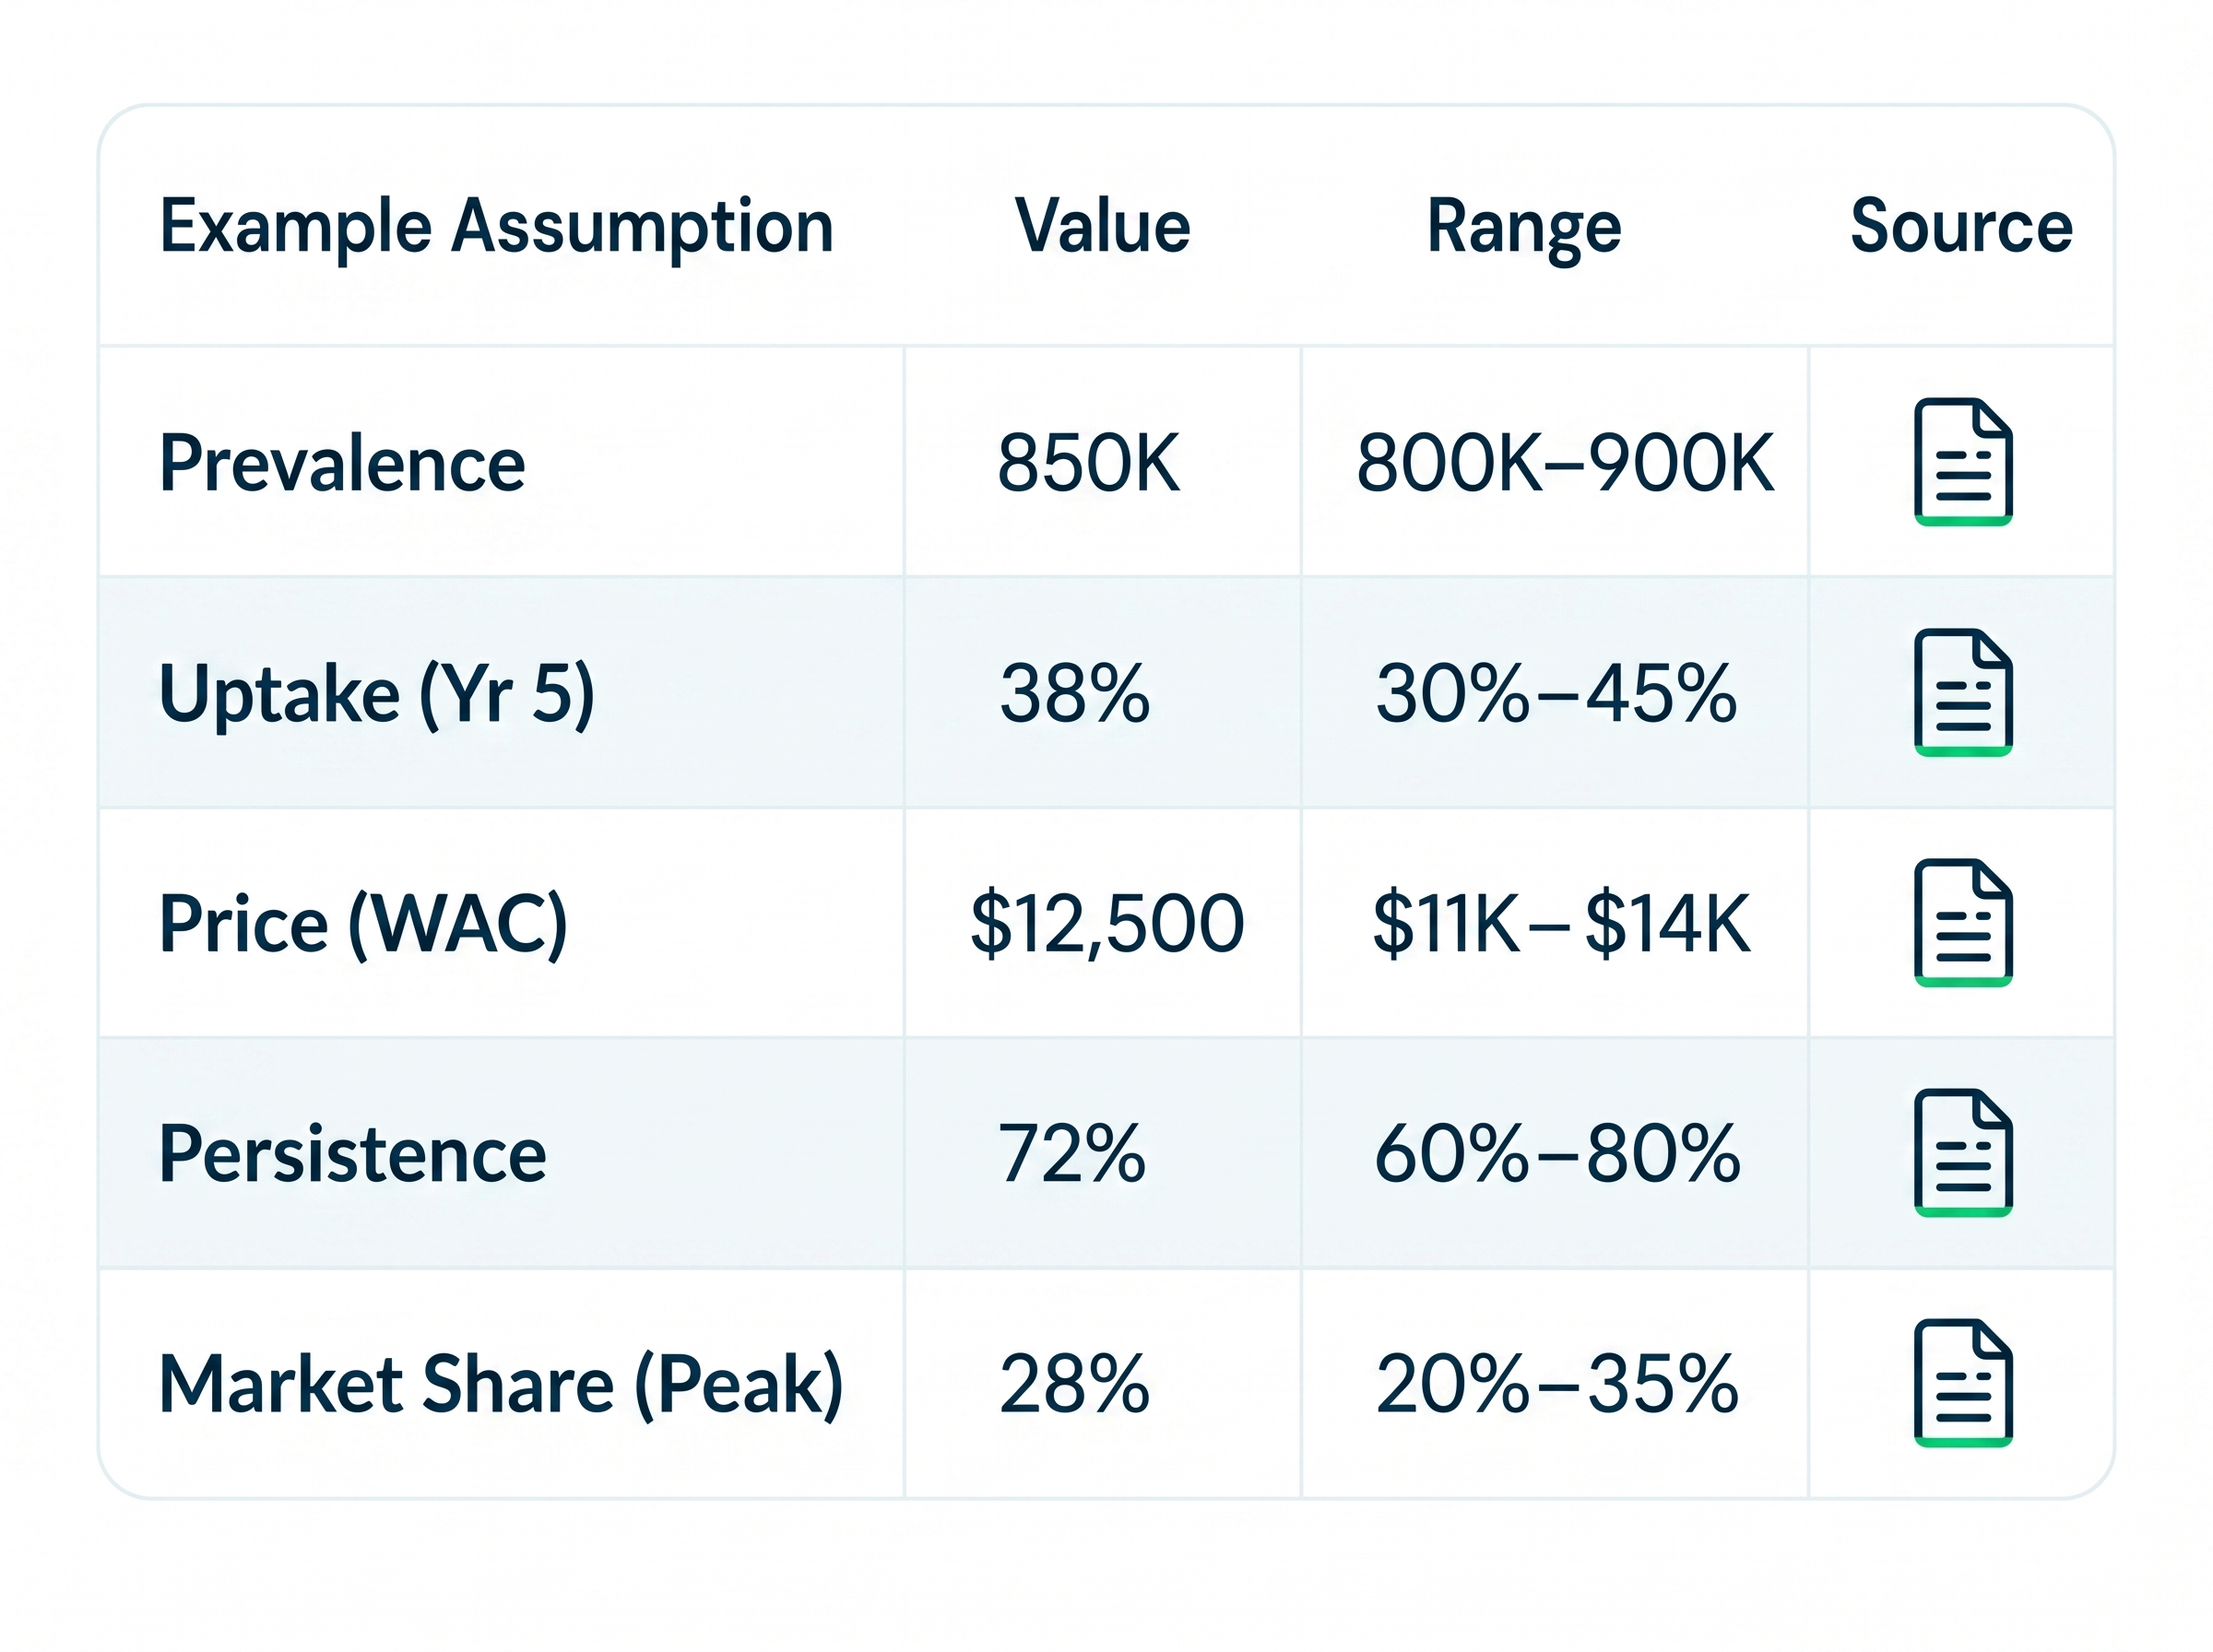
Generate structured assumptions with source context, ranges, and rationale, and editable inputs for analyst review.

Table listing assumptions with values and ranges for Prevalence, Uptake, Price, Persistence, and Market Share.

Source linked documentation

Rationale and range capture

Version history & change tracking

User icon with shield and green check mark symbolizing verified or secure user account.

3

Analyst-controlled AI

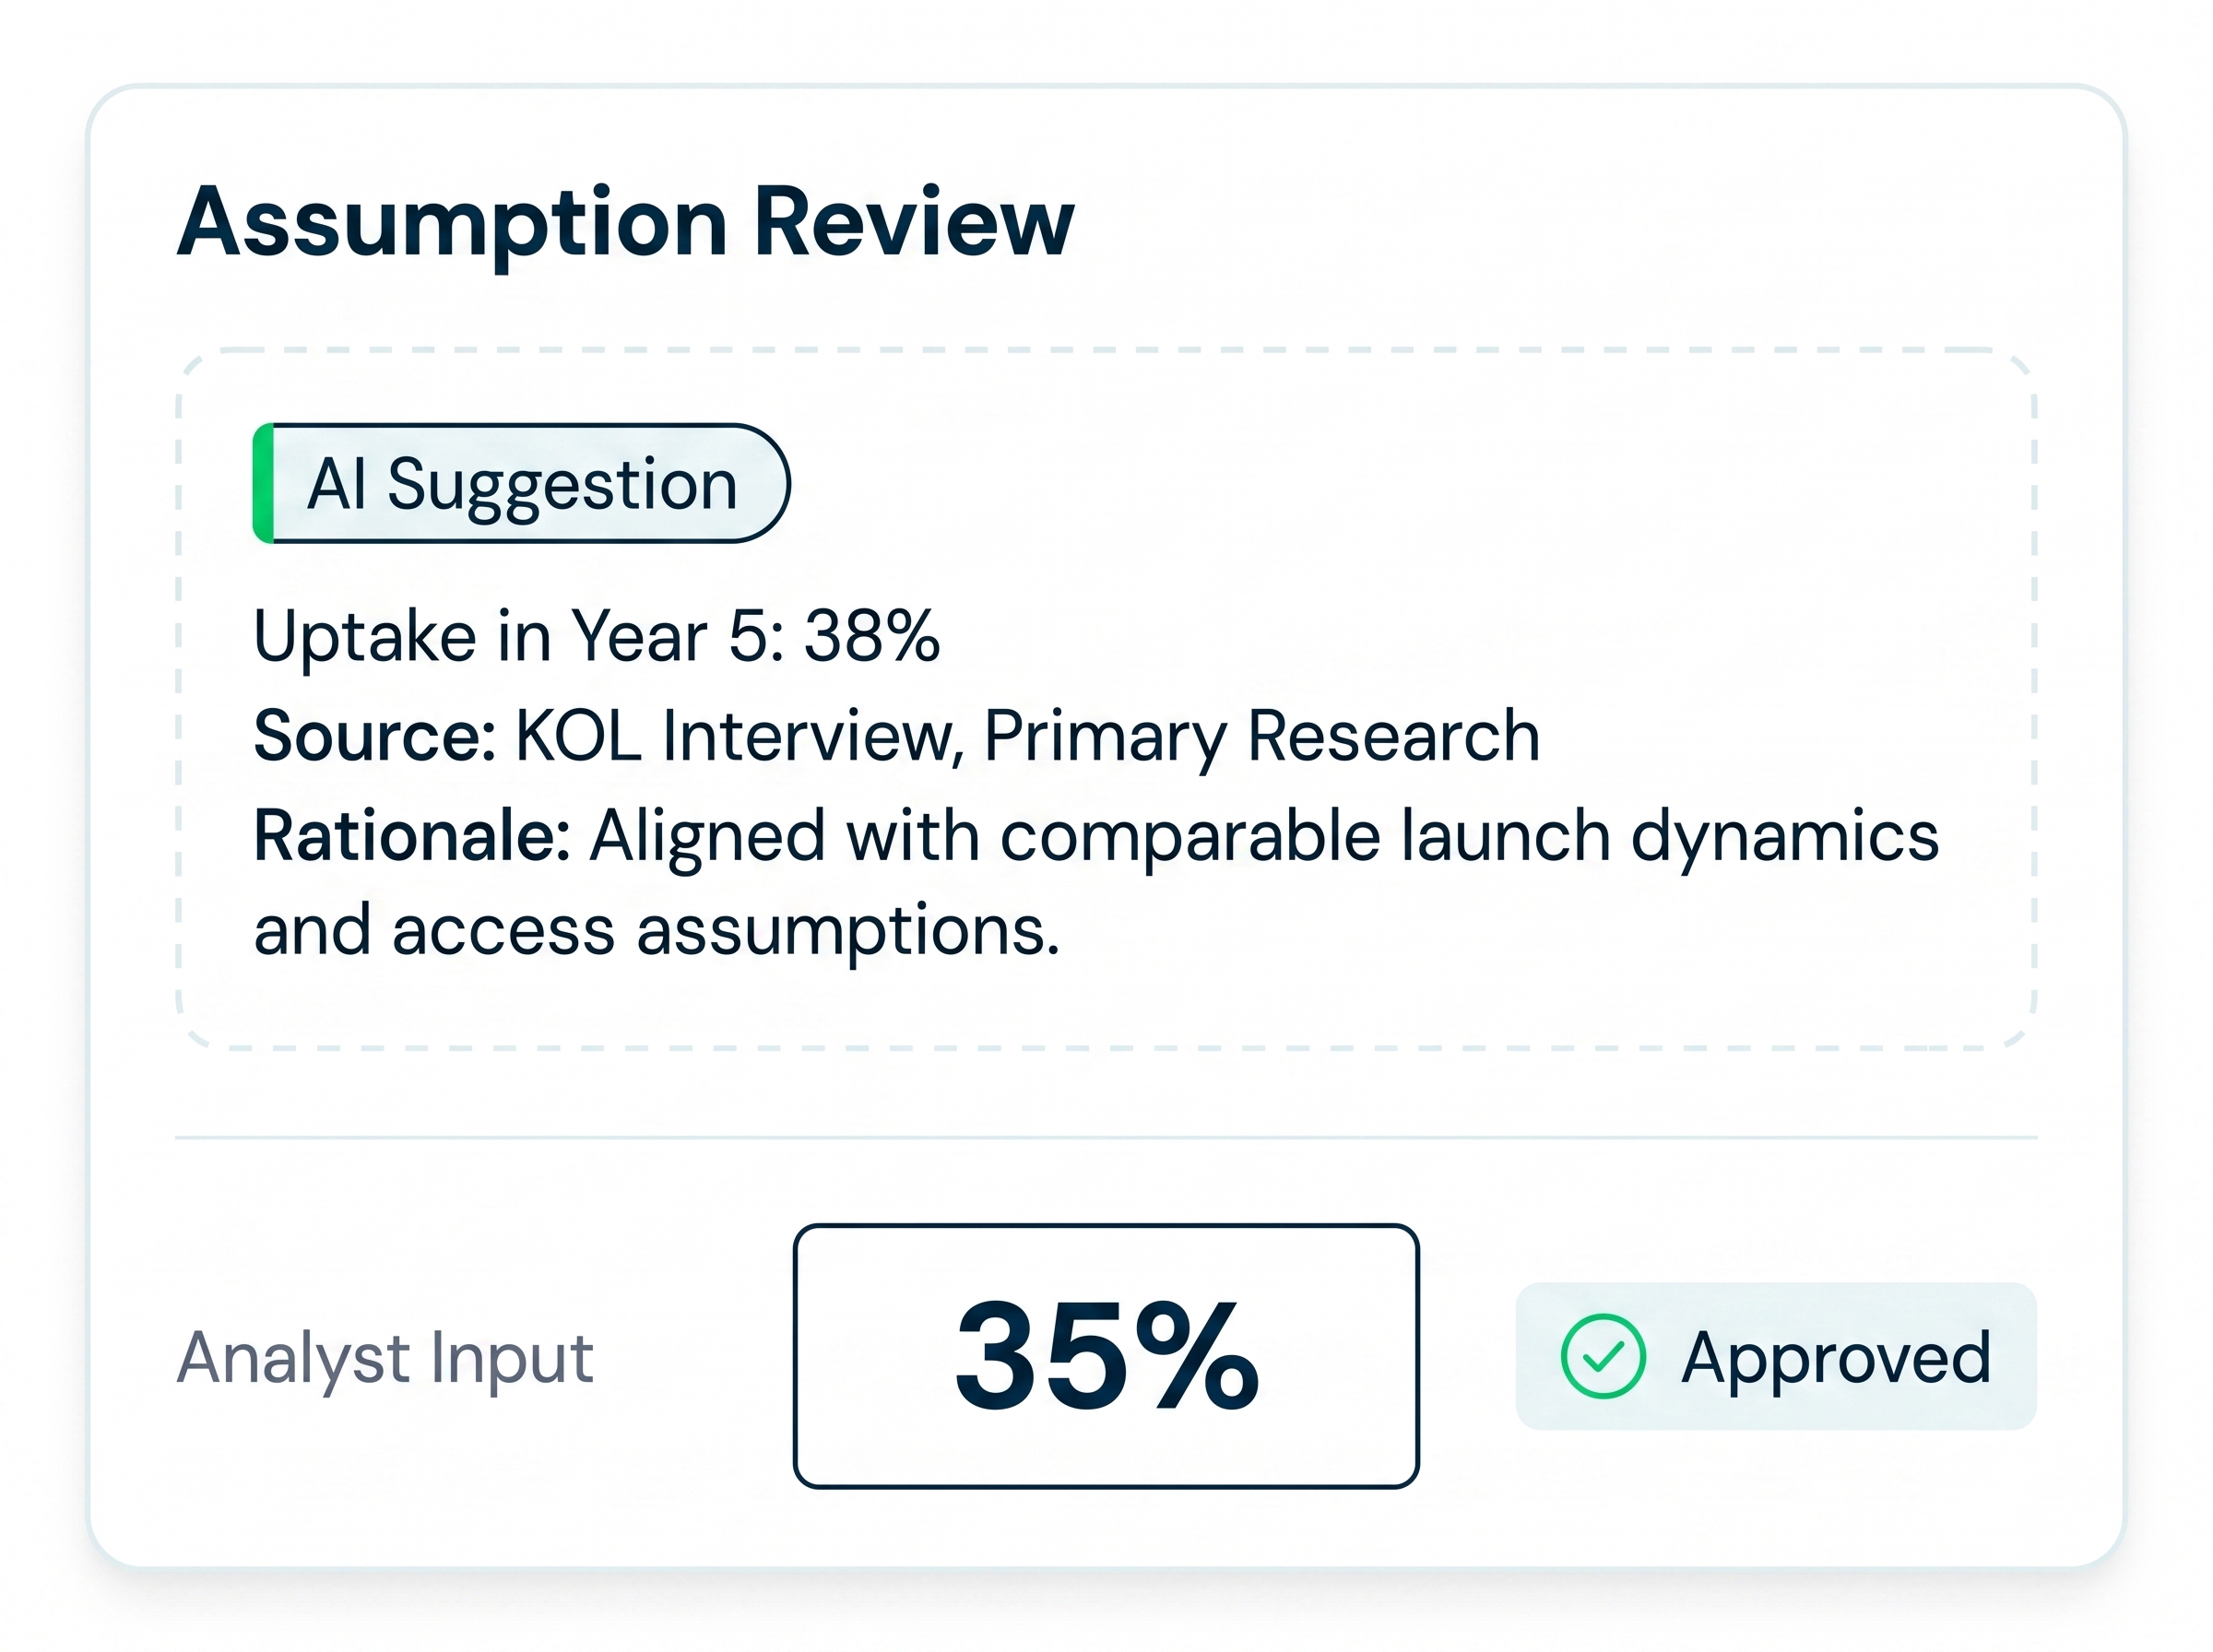
AI accelerates evidence organization and assumption development—analysts review, edit, approve, override, and document final assumptions.

Assumption Review shows AI Suggestion: 38% uptake in Year 5; Analyst Input: 35%, Approved status.

Edit, override, and refine

Approve & document rationale

Full transparency & accountability

Four black arrows pointing up, down, left, and right from a green dot center in a light blue circle.

4

Scenario & sensitivity analysis

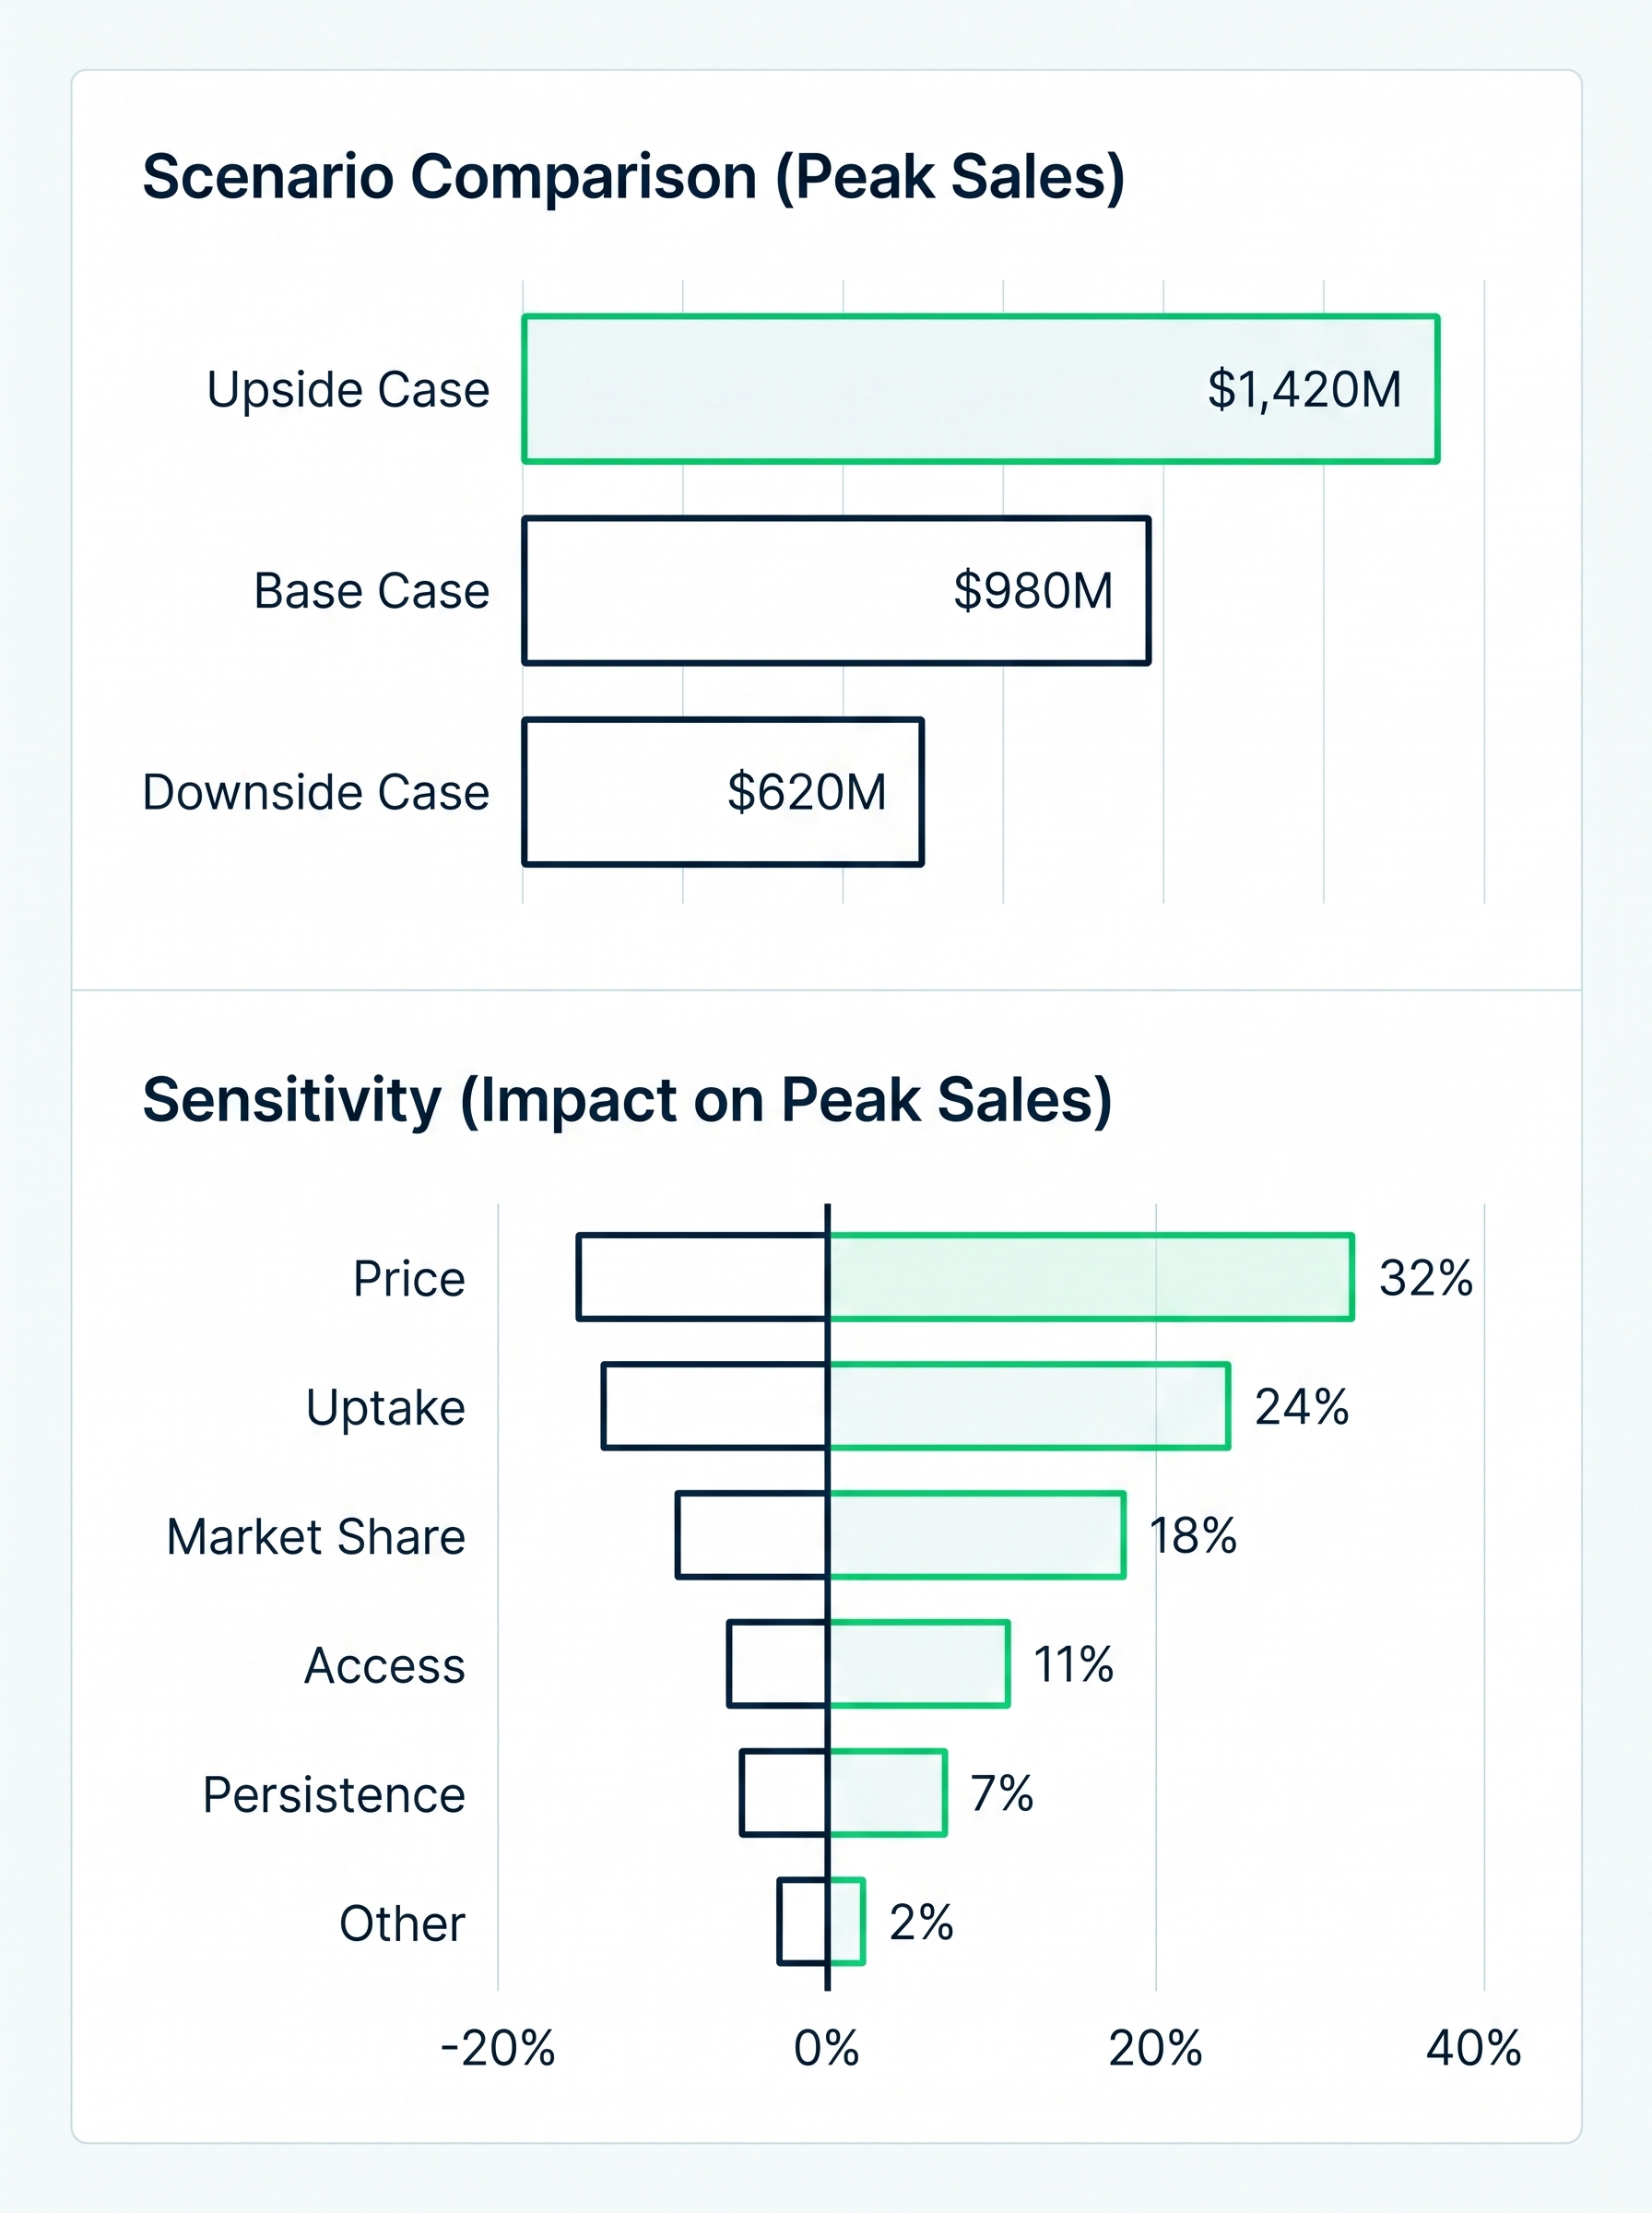
Compare base, upside, downside, and event-driven cases and identify the assumptions that move forecast value the most.

Bar chart comparing peak sales scenarios and sensitivity impact factors like price, uptake, and market share.

Base, upside, downside & custom cases

Tornado & one-way sensitivity

Identify key value drivers

Bar chart with four ascending bars and a green upward arrow indicating growth.

5

Valuation-ready exports

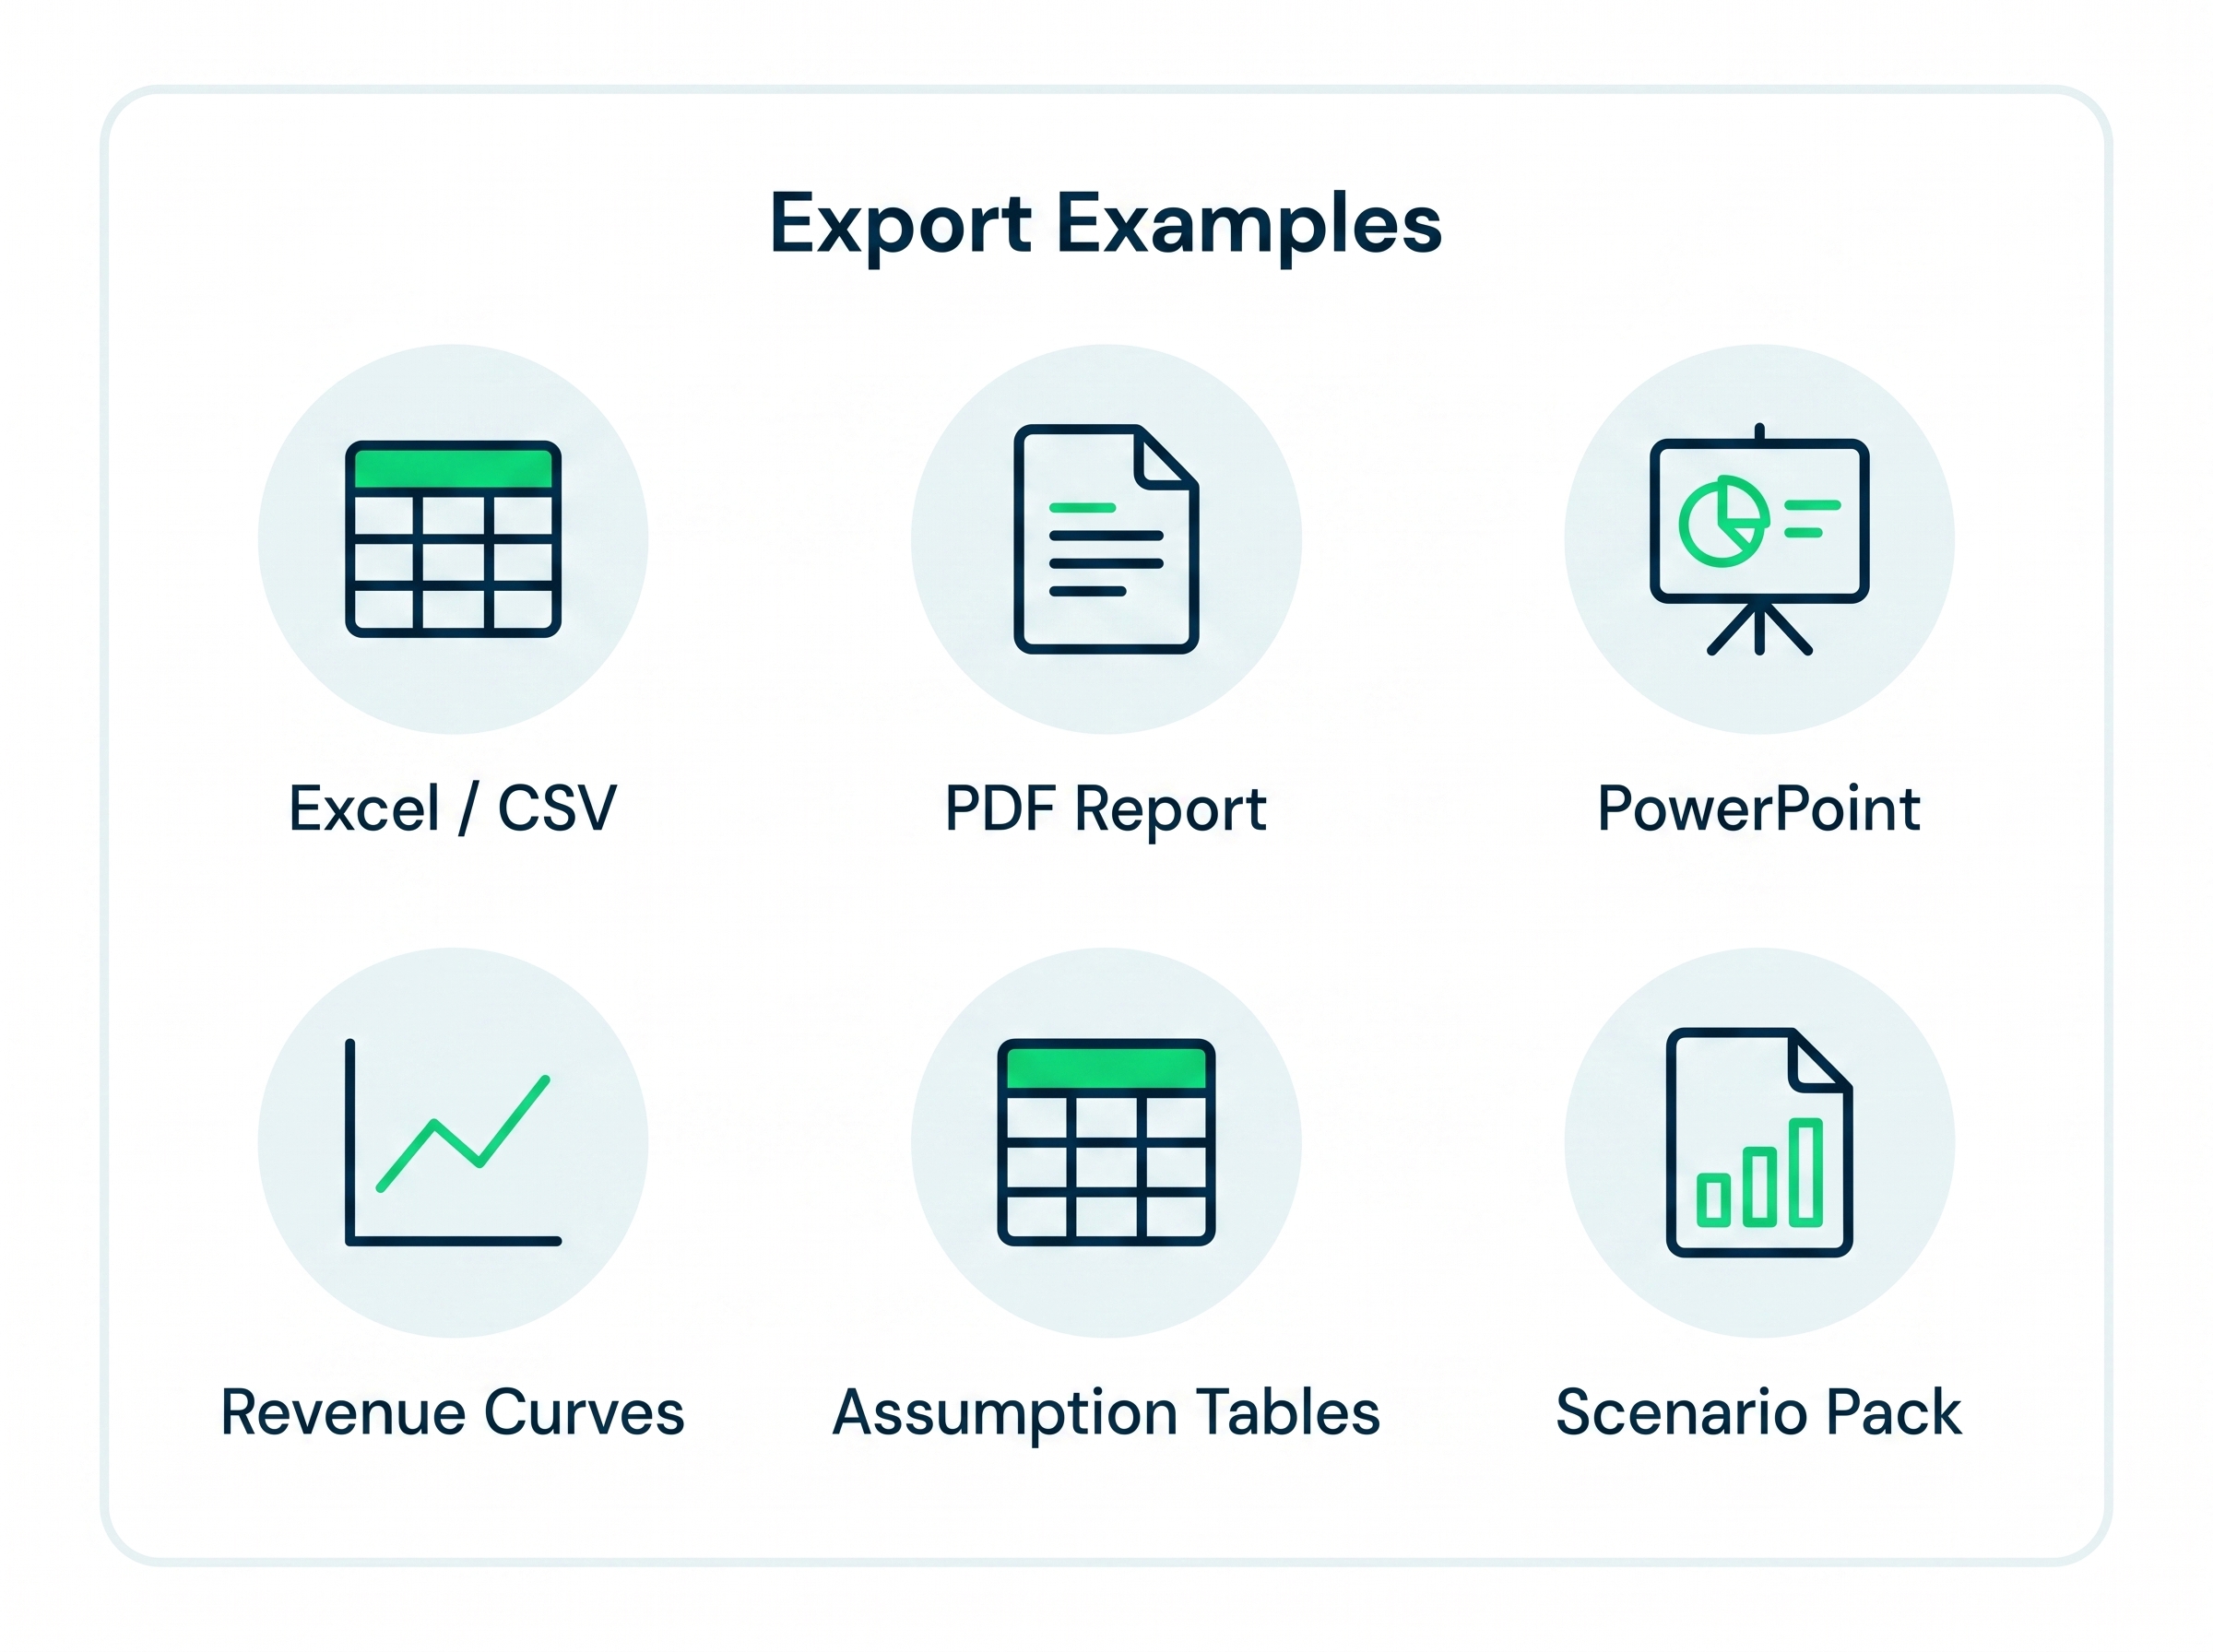
Export revenue curves, patient-flow tables, assumption summaries, scenario packs, sensitivity views, CSV files, PDFs, and PowerPoint-ready materials.

Icons and labels for export examples: Excel/CSV, PDF Report, PowerPoint, Revenue Curves, Assumption Tables, Scenario Pack.

Plug into valuation models

Committee & client ready

Flexible formats for any workflow

Shield outline with a padlock icon inside, symbolizing security and protection.

6

Governance & auditability

Track model history, assumption rationale, review status, source context, and access controls across diligence and investment review workflows.

Audit trail listing assumption created, reviewed, edited, and approved with timestamps on May 8, 2024.

Full history & version control

Role-based access controls

Enterprise-grade security

Evidence

Clinical, commercial, competitive, and market data

black arrow icon
green dot graph icon
Assumptions

Source-traceable assumptions with rationale and ranges

black arrow icon
Patient-flow forecast

Patient-based model drives revenue over time

black arrow icon
Scenarios & sensitivity

Compare cases and test key value drivers

black arrow icon
Governance

Review, approve, and maintain full auditability

black arrow icon
Valuation-ready outputs

Export and integrate into valuation models, memos, and committee decks

black arrow icon
Comparison

Investor challenges PharmaCast-AI helps solve

PharmaCast-AI is designed to give investment teams the speed of modern AI-enabled workflows without losing the transparency and expert judgment required for high-stakes pharmaceutical forecasting.

Team challenge

Brittle, analyst-specific models
Assumptions without a clear audit trail
Slow scenario and sensitivity work
Coverage universe consistency

Traditional workflow

Excel remains essential, but manual model wiring can make forecasts hard to audit, update, and compare across analysts.
In diligence, a peak sales estimate is only as credible as the assumptions underneath it.
Investors need to know what actually drives the thesis.
For teams tracking multiple names or assets, inconsistent model conventions slow reviews and increase model risk.
Benefits

What Teams Gain

Built around your existing workflow:

PharmaCast-AI strengthens the asset-level forecasting layer that feeds your valuation methodology, proprietary templates, and investment judgment - without replacing them.

Flexible, export-ready outputs

Generate CSV and PDF exports that plug directly into Excel, BI tools, and internal review workflows with no extra formatting steps.

Your assumptions stay yours

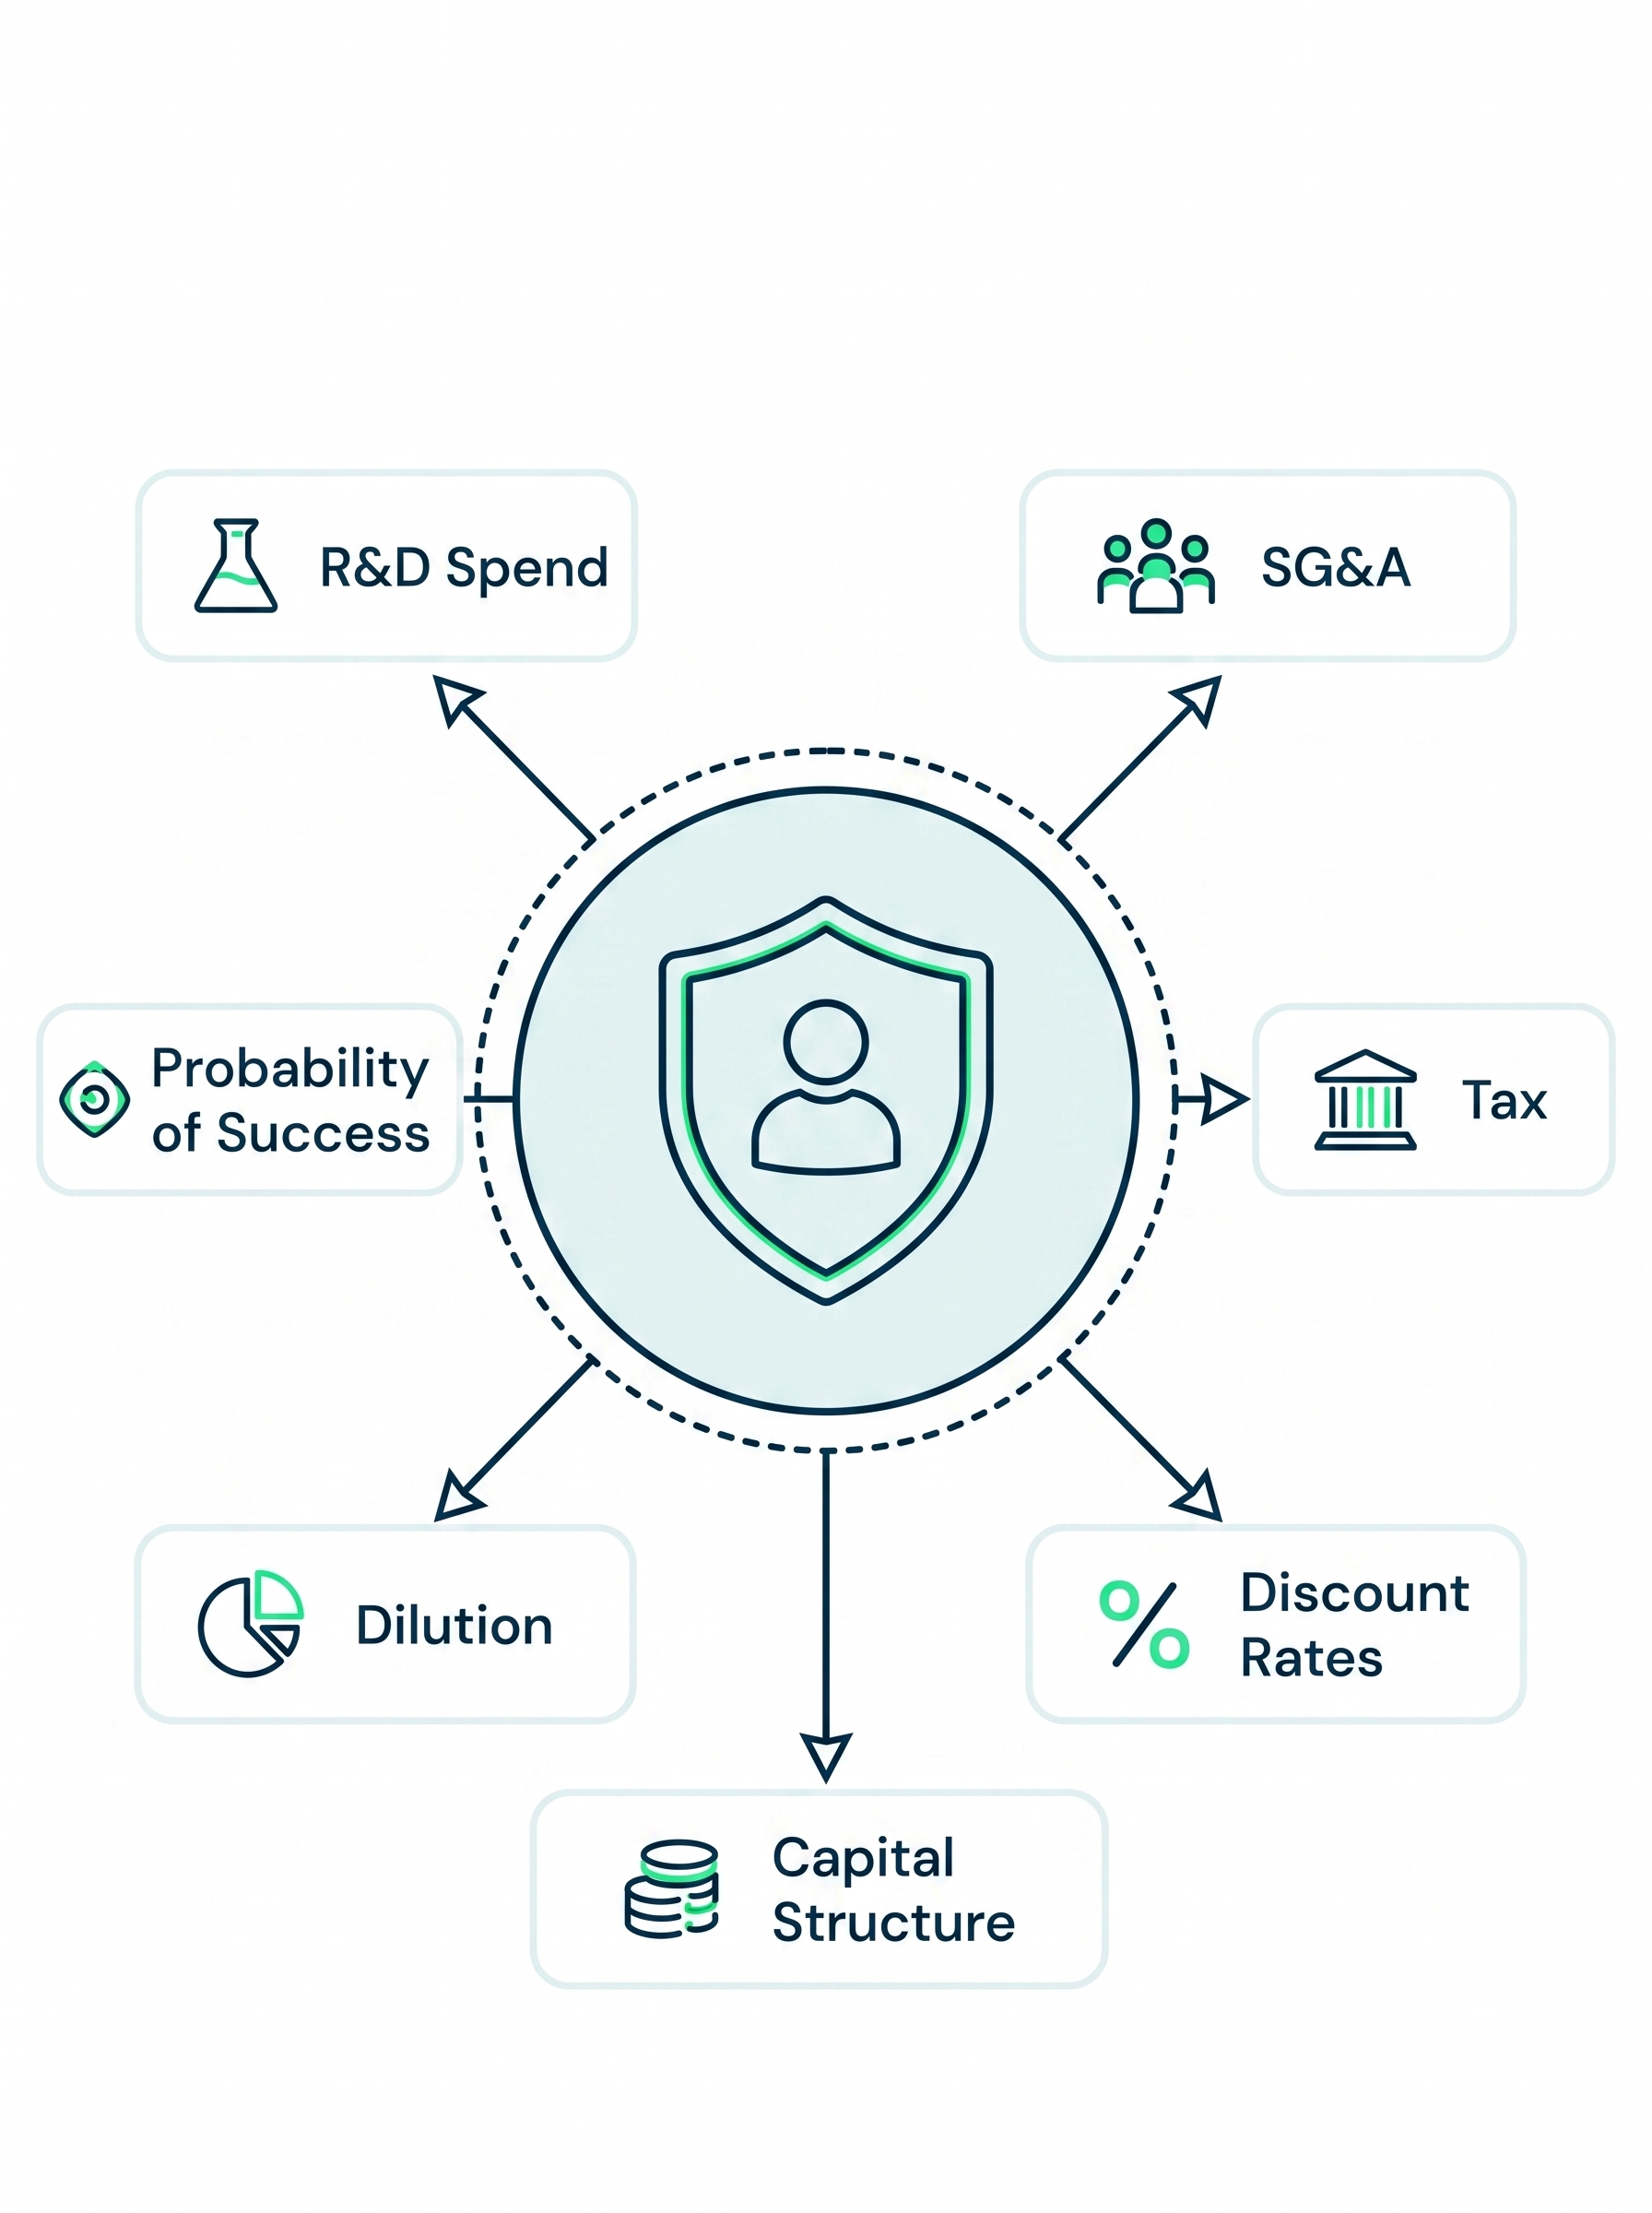
Teams retain full control over R&D spend, SG&A, probability of success, tax, dilution, discount rates, capital structure, and company-level valuation.

More time on what matters

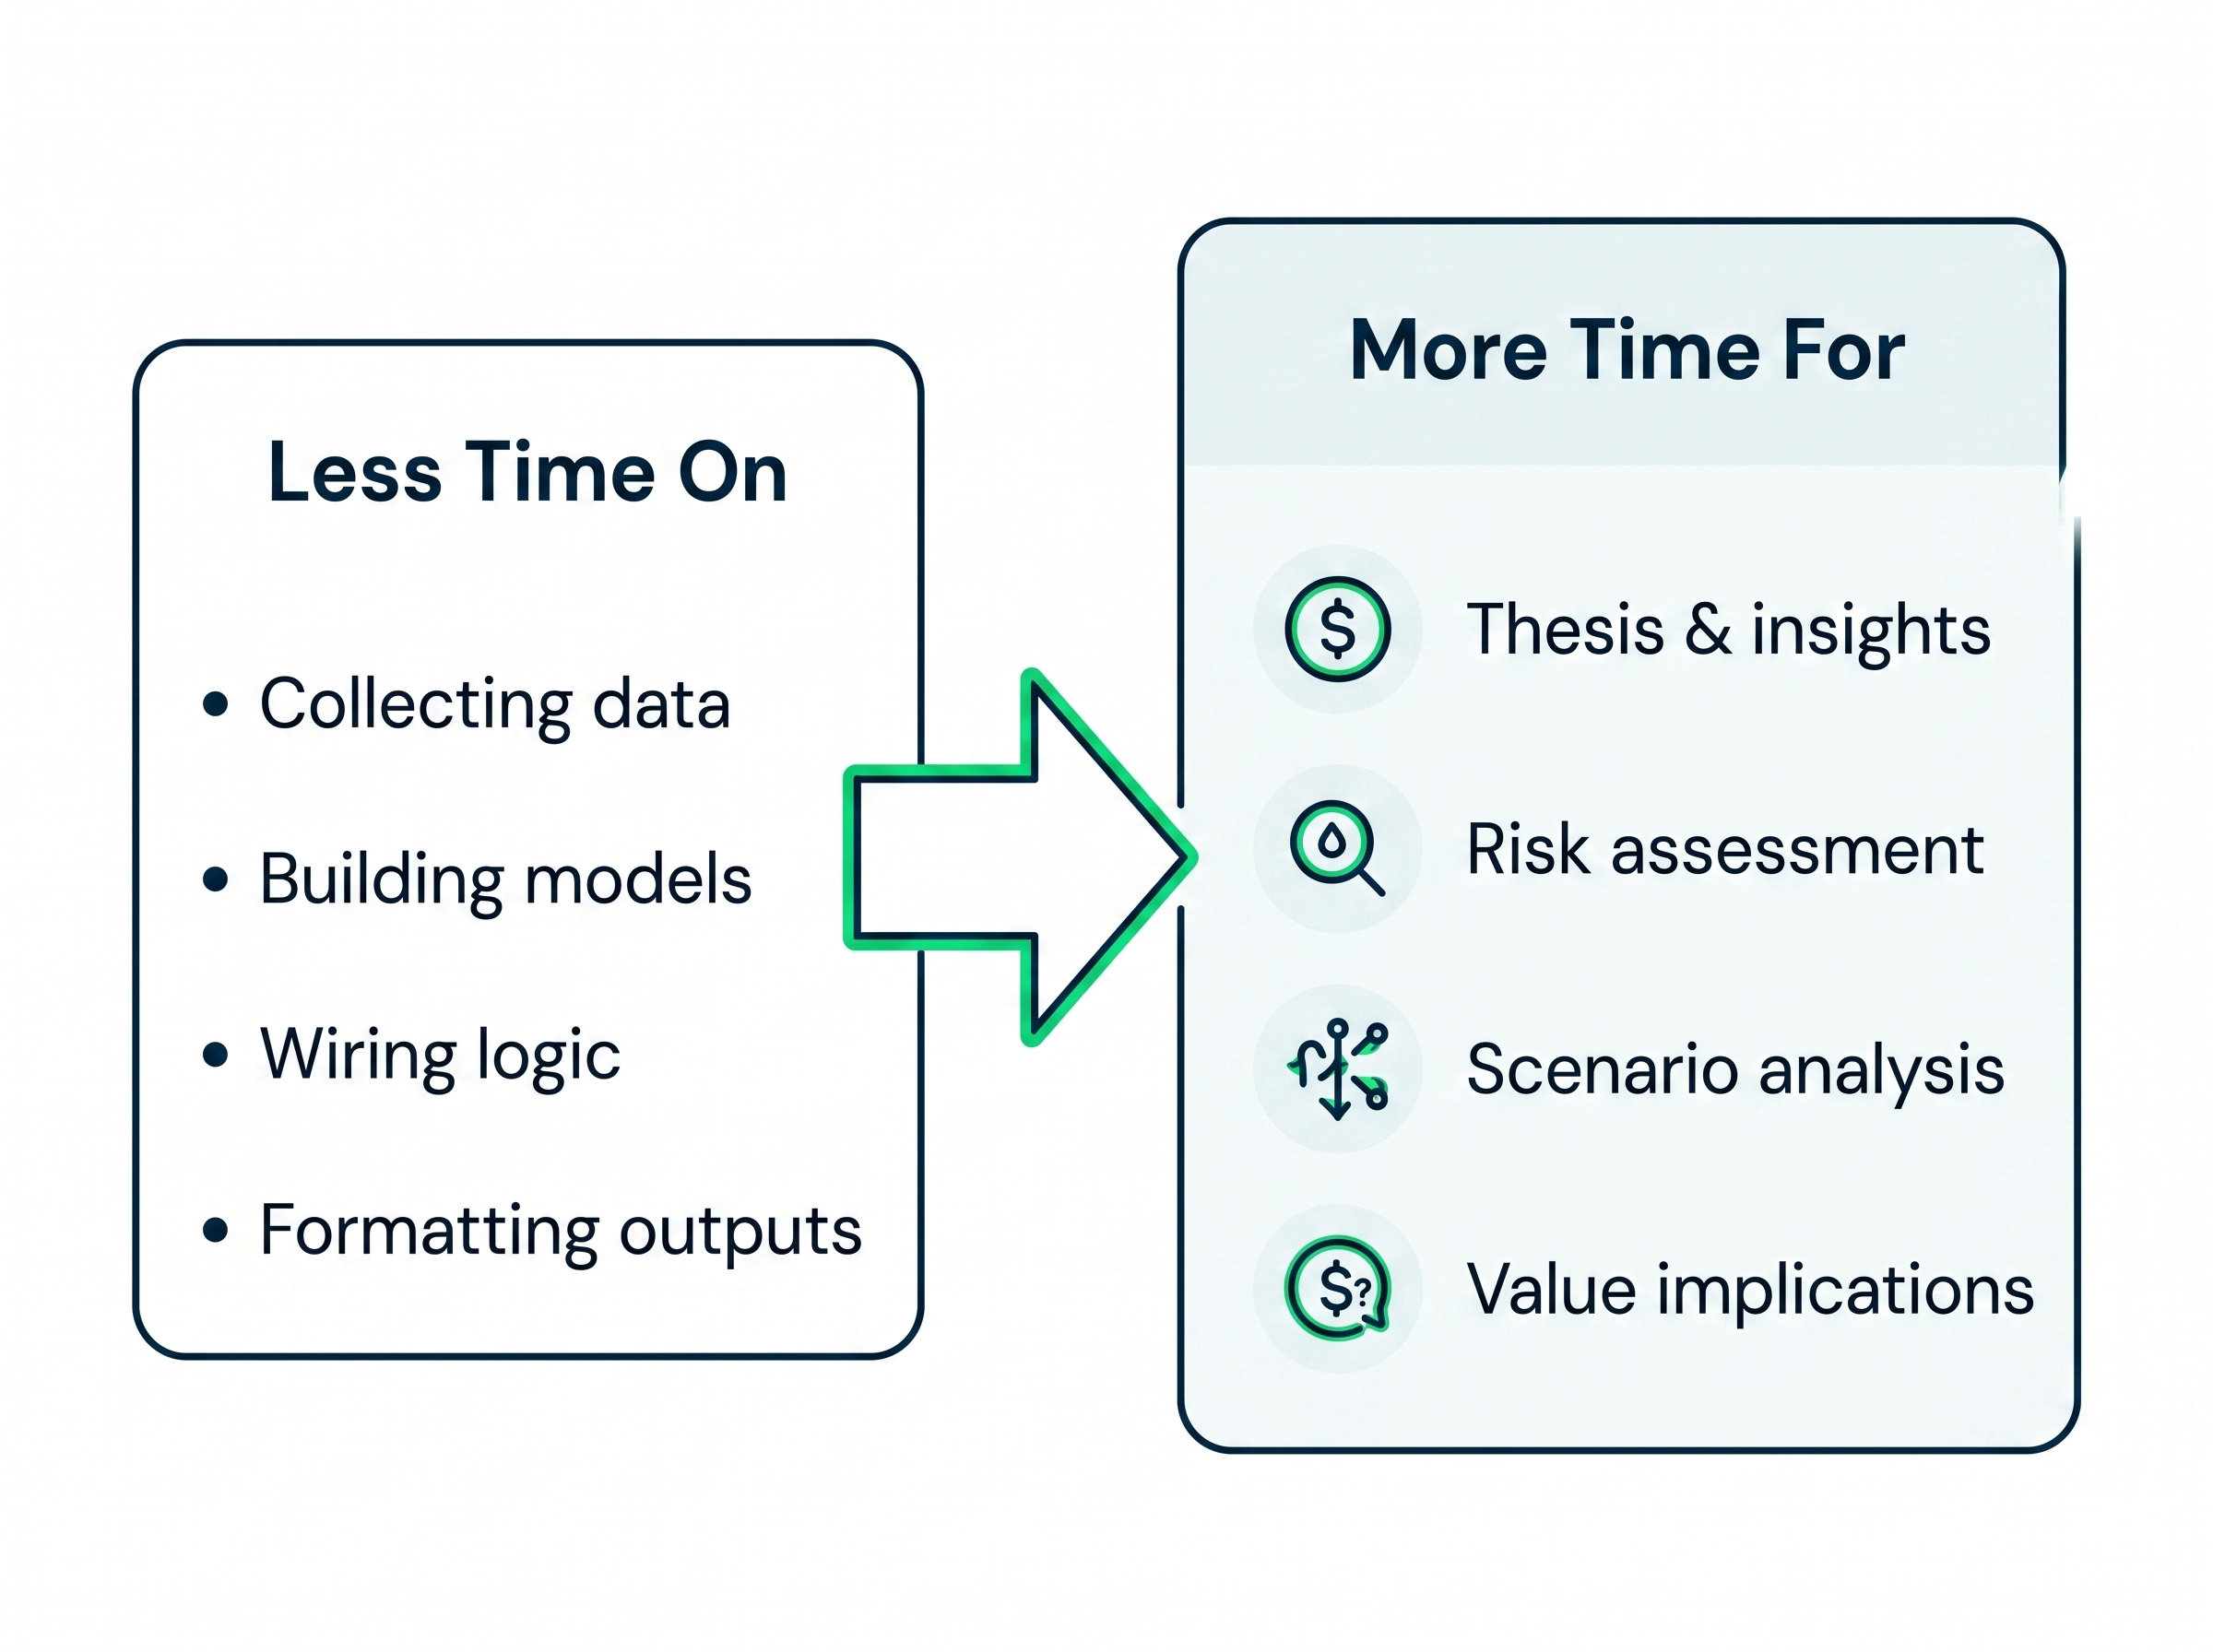
Help analysts spend less time gathering baseline evidence and wiring patient-flow logic, and more time on the thesis, the risks, the assumptions, and the implications for value.

No unnecessary rip-and-replace

Use PharmaCast-AI to enhance existing workflows, with structured exports that can support current models, templates, and presentation materials.

Green outline icon of a clipboard with a dollar sign in the center.

Ready to Get tarted?

What teams gain

Browser window icon with a shield and checkmark symbolizing web security and safety.

1

Built around your existing workflow

PharmaCast-AI strengthens the asset-level forecasting layer that feeds your valuation methodology, proprietary templates, and investment judgment—without replacing them.

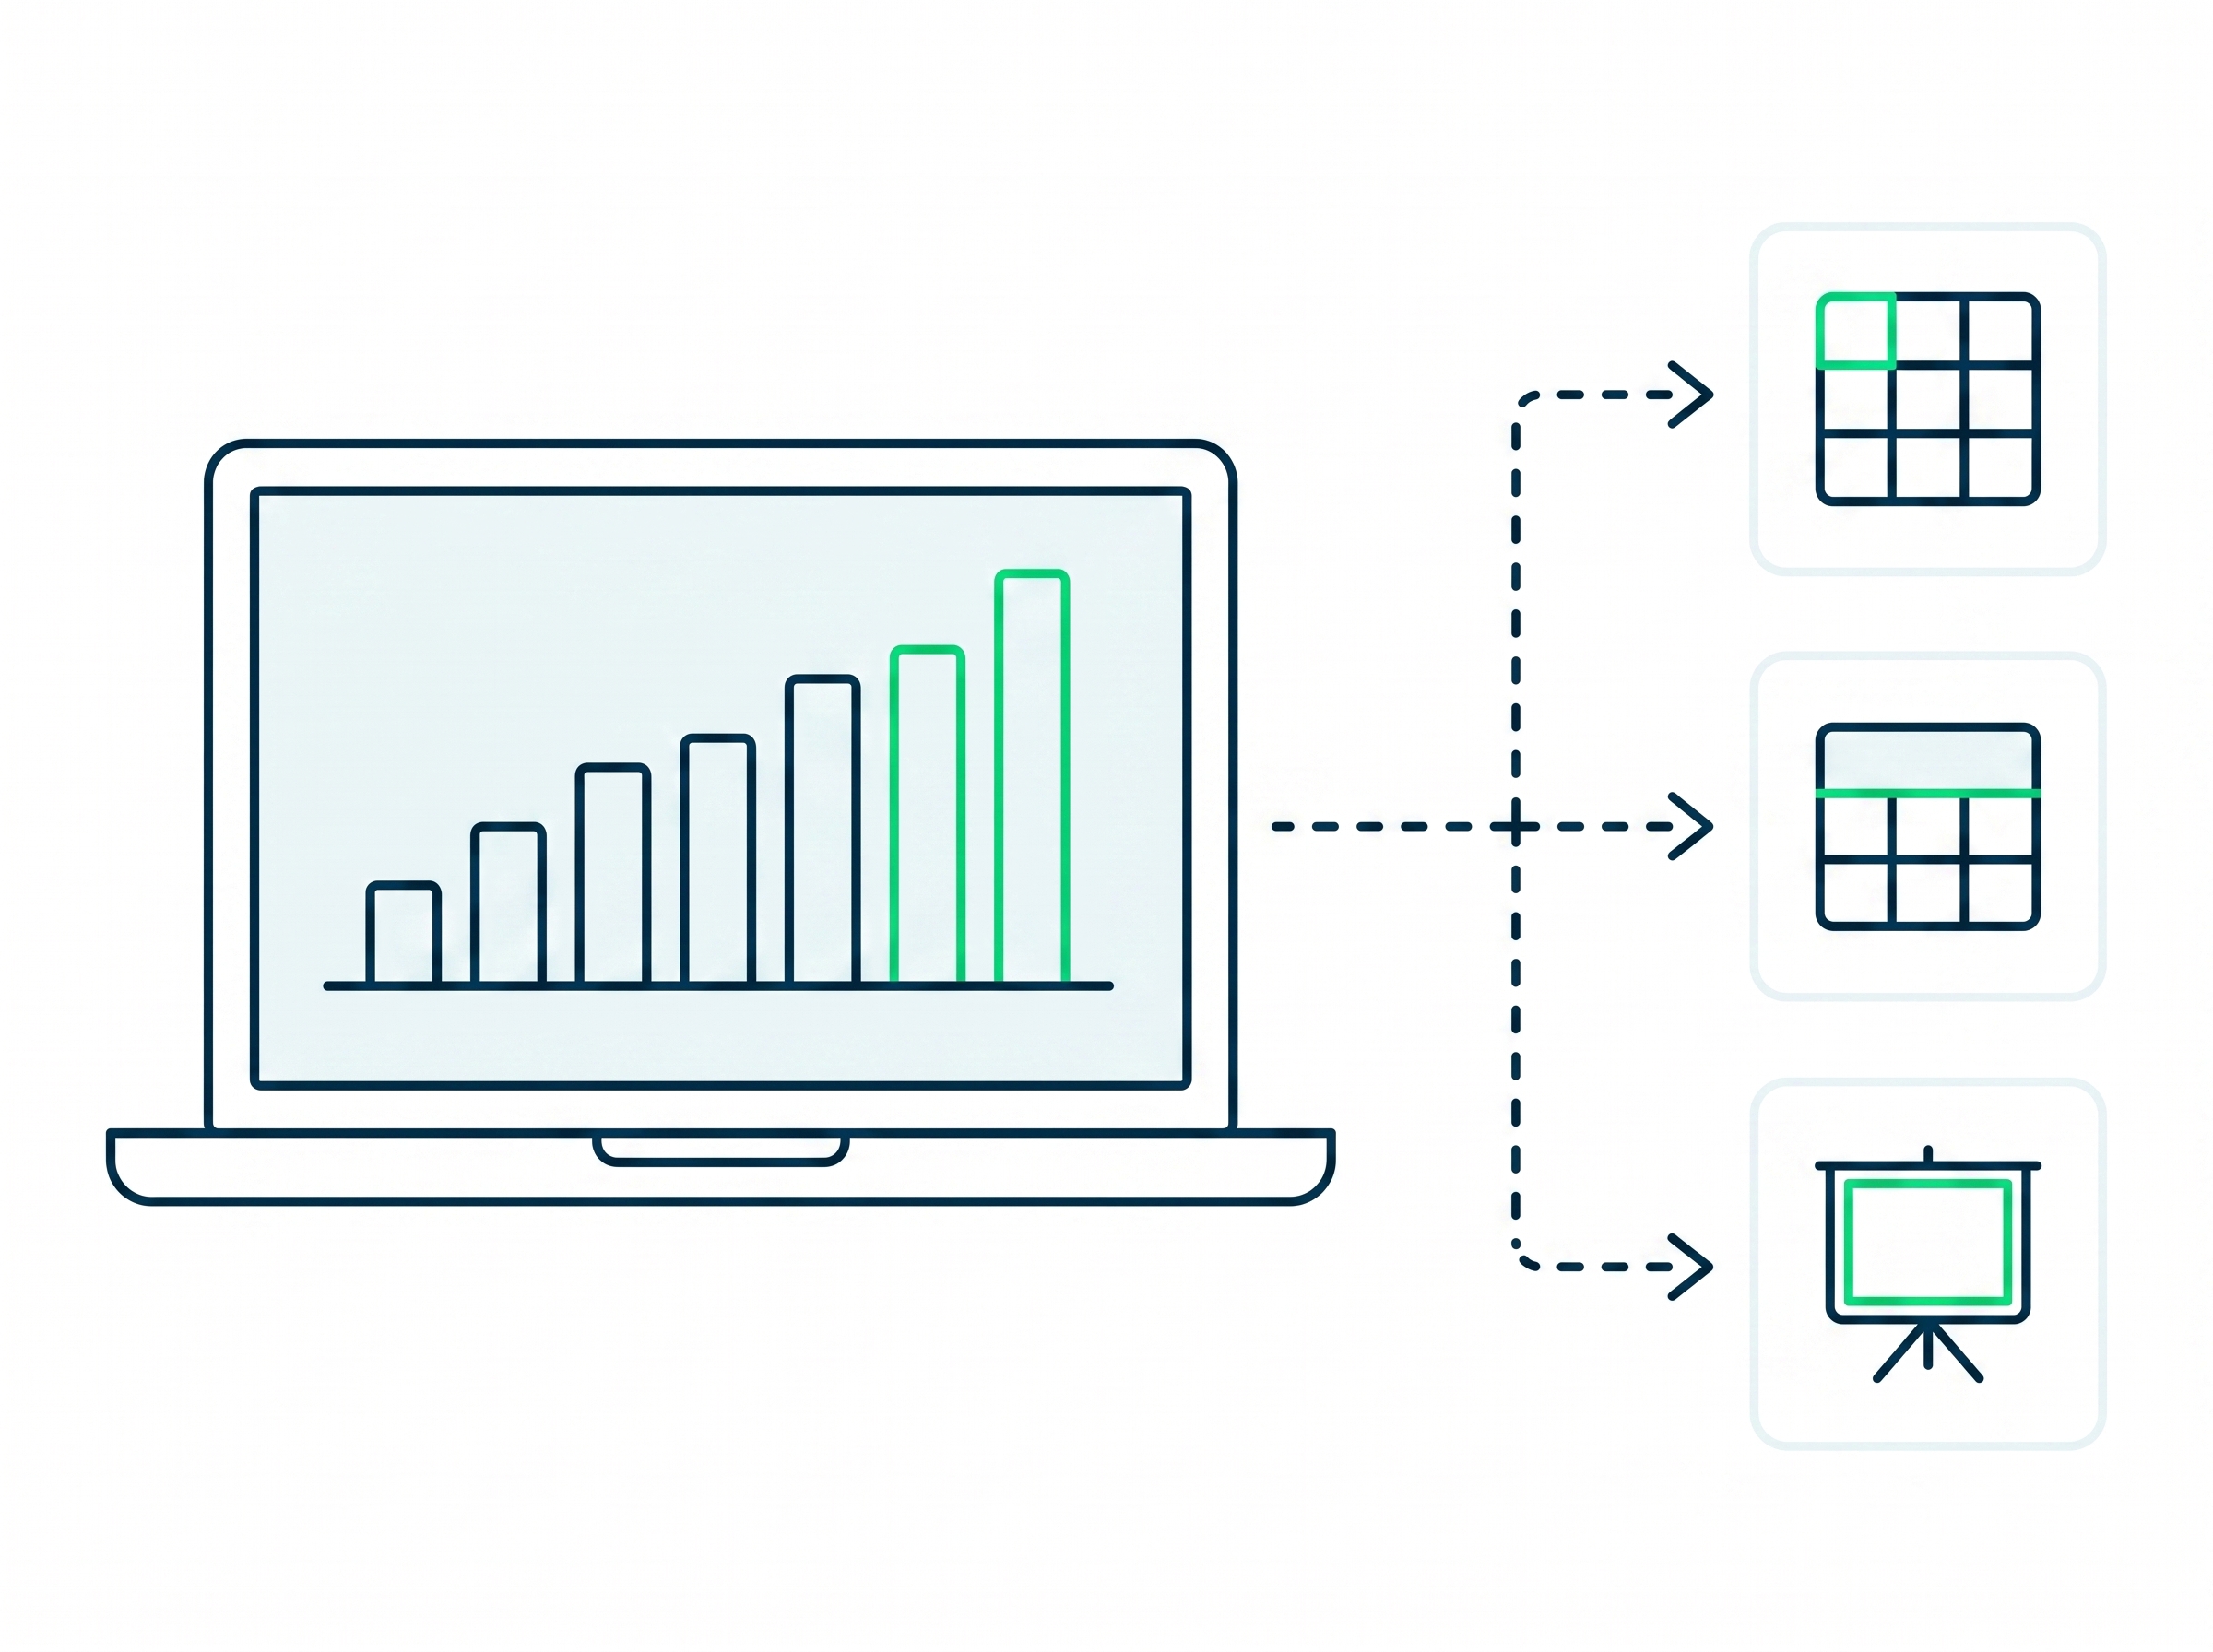
Laptop screen showing a bar chart and arrows pointing to three icons representing data export options.

Seamless integration with existing valuation models

Works with your templates, conventions, and processes

Enhances—never replaces—your workflow

Icon of a spreadsheet grid with a header row and a green fx symbol for formulas

2

Flexible, export-ready outputs

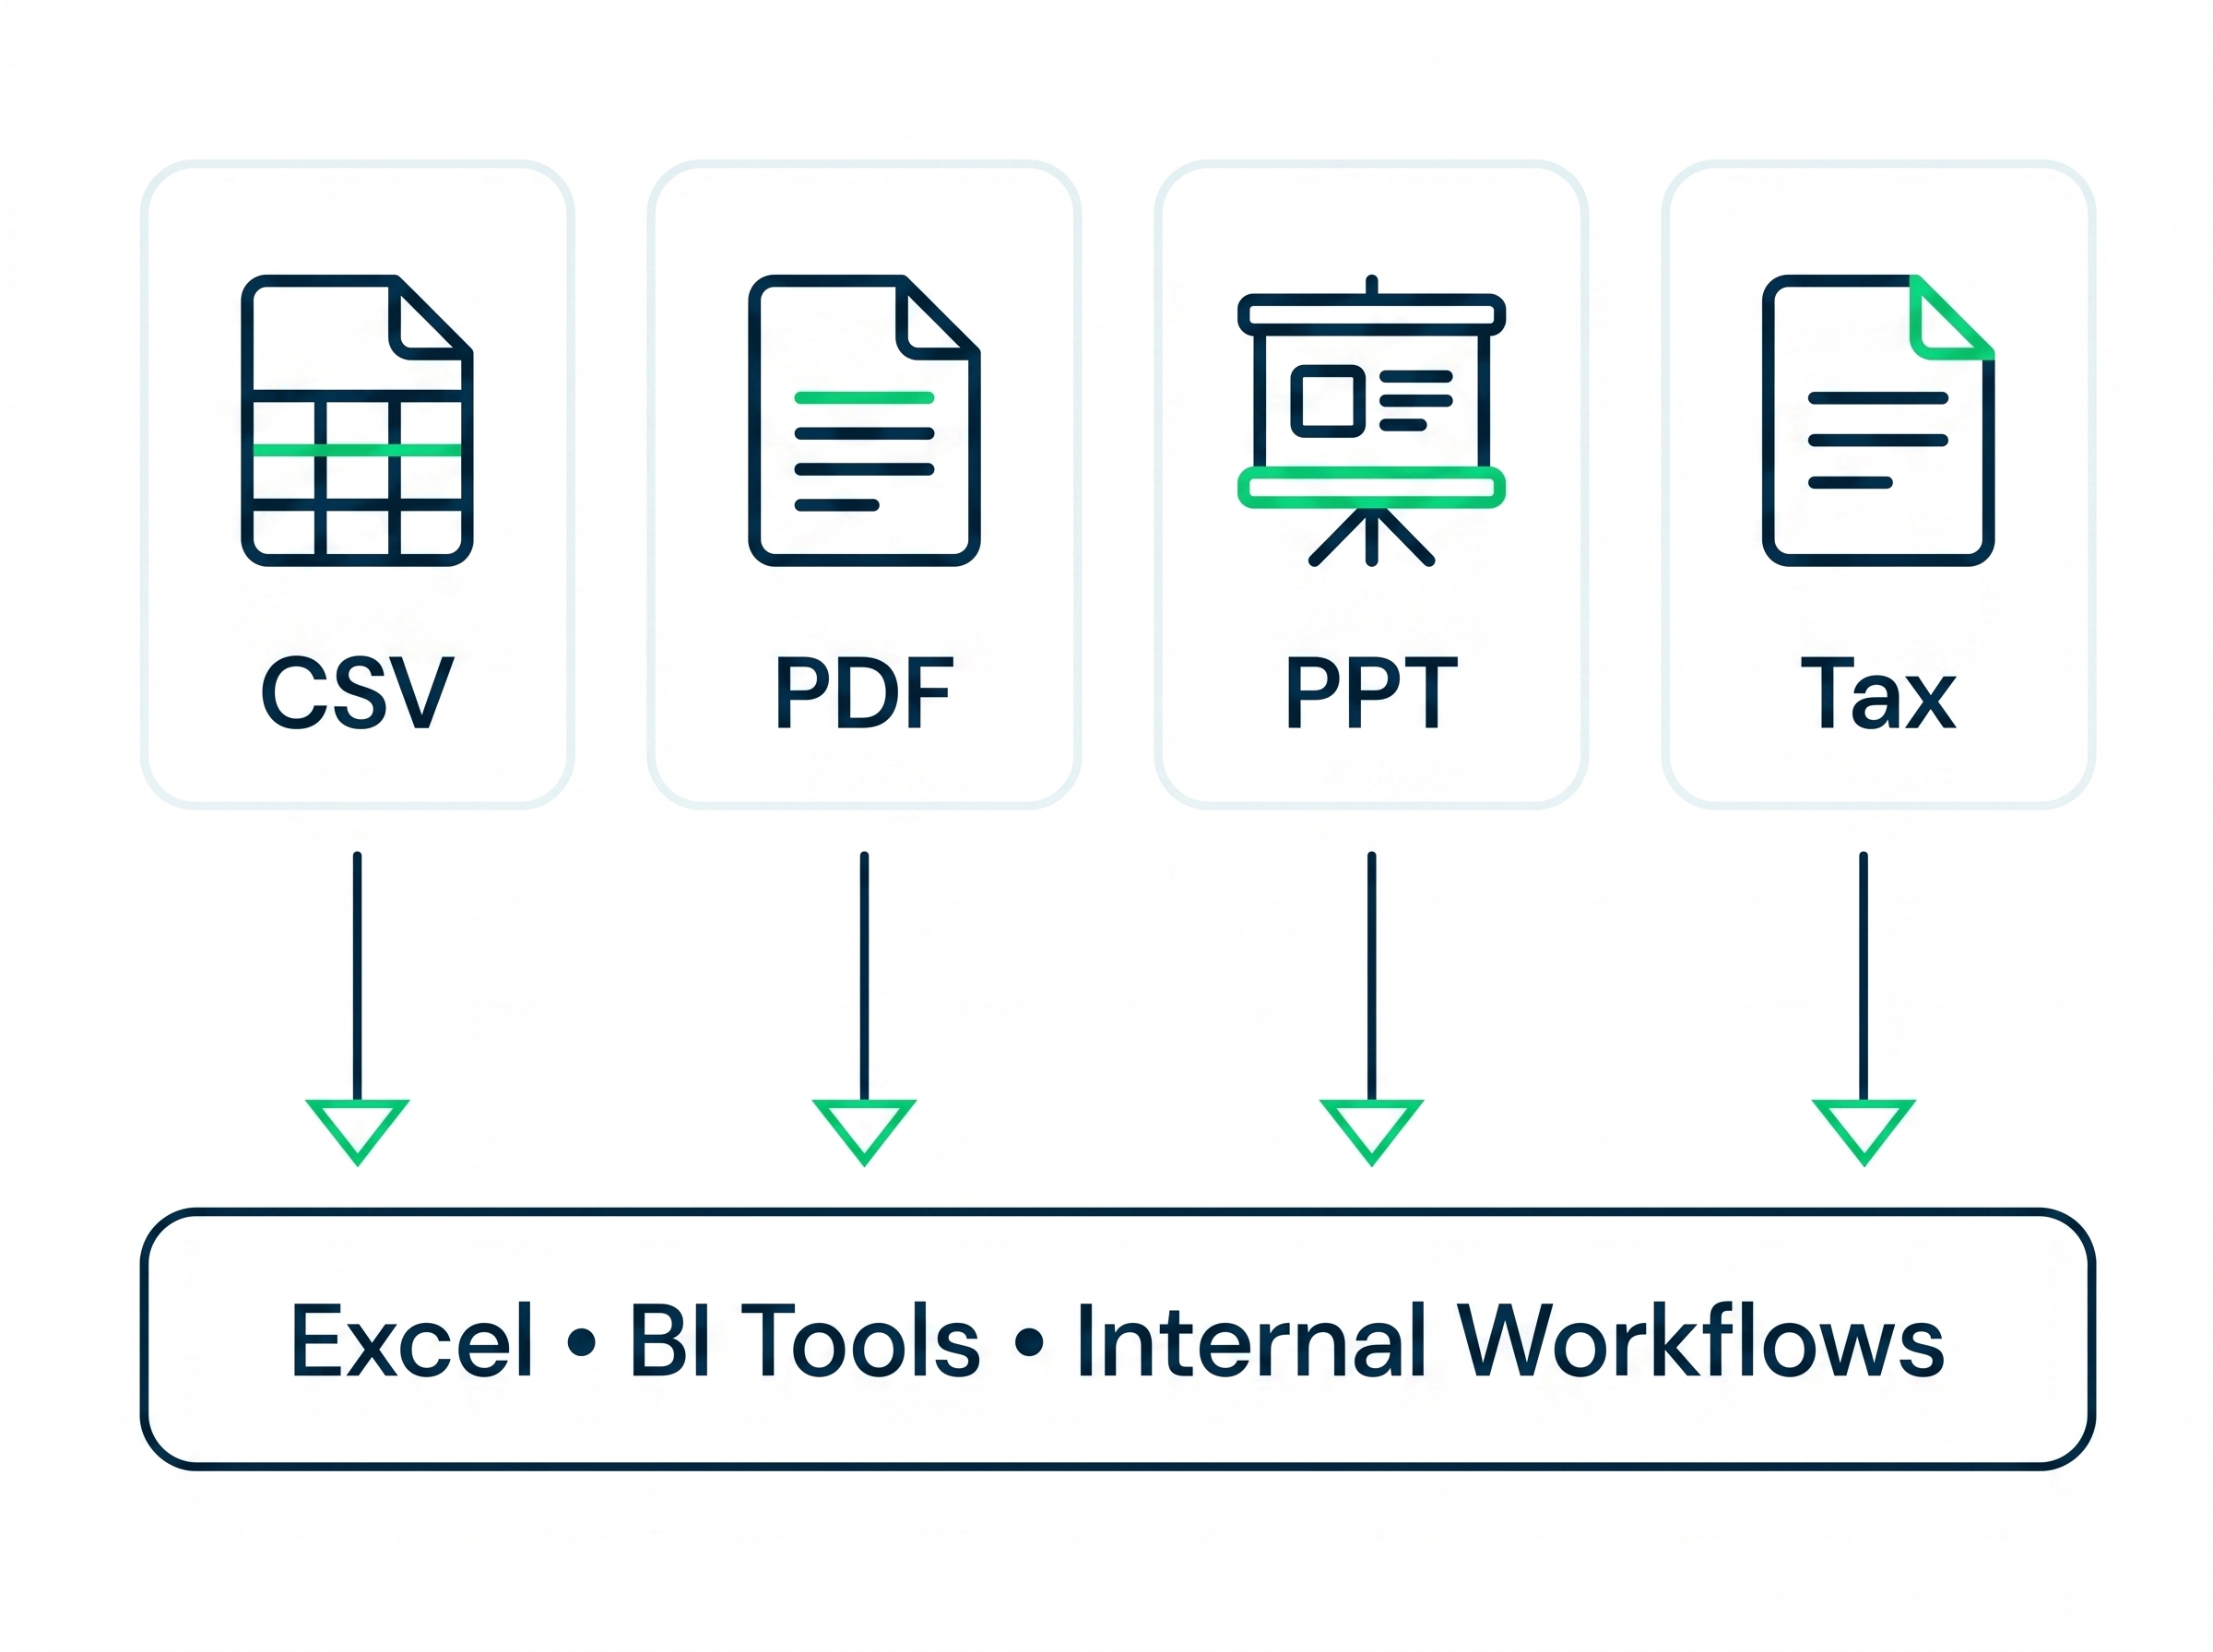
Generate CSV, PDF, and PPT downloadable reports that plug directly into Excel, BI tools, and internal review workflows with no extra formatting steps.

Icons for CSV, PDF, PPT, and Tax files pointing to Excel, BI Tools, and Internal Workflows.

CSV, PDF, and PPT outputs

Plug-and-play with Excel & BI tools

Committee & client-ready materials in minutes

User icon with shield and green check mark symbolizing verified or secure user account.

3

Your assumptions stay yours

Teams retain full control over the critical inputs that drive valuation and return.

Diagram showing factors around a central shield icon: R&D, SG&A, tax, discount rates, capital, dilution, success probability.

Full control of key valuation inputs

Apply your judgment and methodology

Assumptions, rationale, and ownership stay with your team

Circle with pie chart, upward trending line graph, and three rectangles, one highlighted in green.

4

More time on what matters

Help analysts spend less time gathering baseline evidence and wiring patient-flow logic, and more time on the thesis, the thesis, risks, assumptions, and implications for value.

Diagram showing less time on data tasks and more time on thesis, risk, scenario, and value analysis.

Faster turnarounds on catalyst events

More time for high-impact analysis

Deeper focus on driving value

Green check mark inside a black circle with a green outer ring on a white background.

5

No unnecessary rip-and-replace

Use PharmaCast-AI to enhance existing workflows, with structured exports that can support current models, templates, and presentation materials.

Puzzle pieces combining existing models and PharmaCast-AI for stronger forecasts and better decisions.

Enhance what you already use

Lower implementation friction

Better forecasts. Better outcomes.

Evidence

Clinical, commercial, and competitive evidence

black arrow icon
green dot graph icon
Assumptions

Source-traceable assumptions with rationale and ranges

black arrow icon
Patient-flow forecast

Pharma-specific model logic drives revenue over time

black arrow icon
Scenarios & sensitivity

Compare cases and test key value drivers

black arrow icon
Governance

Version control, audit trail, and review workflow

black arrow icon
Valuation-ready outputs

CSV, PDF, PPT reports plug into your workflow

black arrow icon
FAQs

Frequently asked questions

Icon

Does PharmaCast-AI make investment recommendations?

No. PharmaCast-AI is an analytical decision-support platform, not a recommendation engine. It helps investors structure asset forecasts, pressure-test assumptions, cite supporting evidence, and compare scenarios. Buy/sell/hold views, valuation judgments, portfolio decisions, and investment committee recommendations remain entirely with your team.

Icon

Can I export outputs into my existing valuation models?

Yes. PharmaCast-AI is built to work alongside your current valuation process. Forecast outputs, patient-flow logic, revenue projections, and assumption tables can be exported to CSV, PowerPoint, and PDF, so your team can move structured outputs into Excel models, BI tools, diligence memos, and investment committee materials.

Icon

Can the platform handle pre-commercial pharmaceutical & biotech assets?

Yes. PharmaCast-AI is currently designed for assets where much of the value depends on future clinical, regulatory, and commercial assumptions rather than current revenue. Analysts can model patient population, launch timing, label scope, uptake, market share, pricing, treatment duration, persistence, and competitive dynamics, then update assumptions as new evidence emerges.

Icon

How does PharmaCast-AI handle different therapeutic areas?

The platform uses flexible patient-based and patient-flow forecasting structures that can be adapted across oncology, rare disease, specialty, and broader primary care markets. Users can tailor assumptions by indication, line of therapy, patient segment, biomarker or severity group, asset stage, geography, and competitive scenario.

Icon

Where does the AI get its data?

PharmaCast-AI helps organize and document assumptions using public sources, customer-approved materials, licensed data where available, and user-provided diligence inputs. When source support is available, assumptions are presented with citation context and rationale so analysts can review, edit, approve, or override them before they enter the forecast.

Icon

Can we use proprietary diligence findings and internal assumptions?

Yes. PharmaCast-AI is built around analyst judgment. Users can add, edit, override, and document assumptions based on proprietary research, expert interviews, physician checks, management conversations, internal diligence, or investment committee views. The goal is to make expert judgment easier to apply, track, compare, and defend.
Icon

Is our research secure?

PharmaCast-AI is designed as a secure, cloud-based platform with role-based access, audit logs, and controls to help protect proprietary assumptions, diligence findings, forecasts, and model outputs. Your team controls how internal research is incorporated into each forecast.

Icon

Does PharmaCast-AI replace Excel?

No. For many finance and investment teams, Excel remains the final valuation environment. PharmaCast-AI supports the upstream forecasting workflow by reducing manual research, assumption structuring, and patient-flow modeling burden, then exports organized outputs that can be used in your existing Excel-based valuation process.

get started

Build a more defensible investment thesis

Healthcare investing requires speed, rigor, and clear judgment. PharmaCast-AI helps your team move from clinical and commercial evidence to a source-traceable asset forecast with greater transparency, consistency, and control.

See how PharmaCast-AI can help your analysts evaluate pharma and biotech opportunities faster, pressure-test the drivers of value, and communicate investment assumptions with confidence.